| |||||||||||||||||||||||||||||||||||||||||||||||||||||||||||||
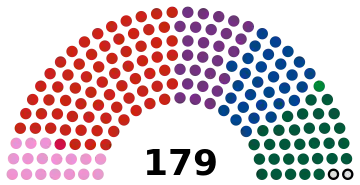
All 179 seats in the Folketing 90 seats needed for a majority | |||||||||||||||||||||||||||||||||||||||||||||||||||||||||||||
| Turnout | 87.16% | ||||||||||||||||||||||||||||||||||||||||||||||||||||||||||||
|---|---|---|---|---|---|---|---|---|---|---|---|---|---|---|---|---|---|---|---|---|---|---|---|---|---|---|---|---|---|---|---|---|---|---|---|---|---|---|---|---|---|---|---|---|---|---|---|---|---|---|---|---|---|---|---|---|---|---|---|---|---|
This lists parties that won seats. See the complete results below.
| |||||||||||||||||||||||||||||||||||||||||||||||||||||||||||||
General elections were held in Denmark on 21 September 1971 and in the Faroe Islands on 5 October.[1][2] The Social Democratic Party remained the largest in the Folketing, with 70 of the 179 seats. Voter turnout was 87% in Denmark proper, 57% in the Faroe Islands and 52% in Greenland (where only one of the two constituencies was contested as the other had only a single candidate who was elected unopposed).[3]
Electoral system
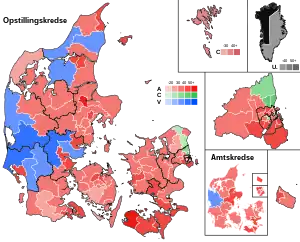
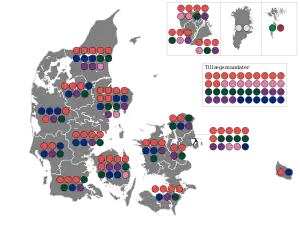
All members were elected by party-list proportional representation in multi-member constituencies and in levelling seats filled at-large using overall party vote shares. The districts elected between 2 and 14 members each. They were the first elections using the new counties as constituencies.
Results
 | |||||
|---|---|---|---|---|---|
| Party | Votes | % | Seats | +/– | |
| Denmark proper | |||||
| Social Democrats | 1,074,777 | 37.27 | 70 | +8 | |
| Conservative People's Party | 481,335 | 16.69 | 31 | –6 | |
| Venstre | 450,904 | 15.64 | 30 | –4 | |
| Danish Social Liberal Party | 413,620 | 14.34 | 27 | 0 | |
| Socialist People's Party | 262,756 | 9.11 | 17 | +6 | |
| Christian People's Party | 57,072 | 1.98 | 0 | New | |
| Justice Party of Denmark | 50,231 | 1.74 | 0 | 0 | |
| Left Socialists | 45,979 | 1.59 | 0 | –4 | |
| Communist Party of Denmark | 39,564 | 1.37 | 0 | 0 | |
| Schleswig Party | 6,743 | 0.23 | 0 | 0 | |
| Independents | 919 | 0.03 | 0 | 0 | |
| Total | 2,883,900 | 100.00 | 175 | 0 | |
| Valid votes | 2,883,900 | 99.30 | |||
| Invalid/blank votes | 20,196 | 0.70 | |||
| Total votes | 2,904,096 | 100.00 | |||
| Registered voters/turnout | 3,332,004 | 87.16 | |||
| Faroe Islands | |||||
| Social Democratic Party | 4,170 | 31.77 | 1 | 0 | |
| Union Party | 2,855 | 21.75 | 0 | 0 | |
| People's Party | 2,680 | 20.42 | 1 | 0 | |
| Self-Government | 648 | 4.94 | 0 | New | |
| Progress Party | 362 | 2.76 | 0 | 0 | |
| Independents | 2,410 | 18.36 | 0 | New | |
| Total | 13,125 | 100.00 | 2 | 0 | |
| Valid votes | 13,125 | 99.42 | |||
| Invalid/blank votes | 77 | 0.58 | |||
| Total votes | 13,202 | 100.00 | |||
| Registered voters/turnout | 23,260 | 56.76 | |||
| Greenland | |||||
| Independents | 7,148 | 100.00 | 2 | 0 | |
| Total | 7,148 | 100.00 | 2 | 0 | |
| Valid votes | 7,148 | 97.34 | |||
| Invalid/blank votes | 195 | 2.66 | |||
| Total votes | 7,343 | 100.00 | |||
| Registered voters/turnout | 14,104 | 52.06 | |||
| Source: Nohlen & Stöver, Danmarks Statistik | |||||
References
| Folketing elections |
|
|---|---|
| Landsting elections | |
| European elections | |
| Local elections | |
| Other elections |
|
| Referendums | |
| |
This article is issued from Wikipedia. The text is licensed under Creative Commons - Attribution - Sharealike. Additional terms may apply for the media files.