| |||||||||||||||||||||||||||||||||||||||||||||||||
24 of 66 seats (One Third and two by-elections) to Wirral Metropolitan Borough Council 34 seats needed for a majority | |||||||||||||||||||||||||||||||||||||||||||||||||
|---|---|---|---|---|---|---|---|---|---|---|---|---|---|---|---|---|---|---|---|---|---|---|---|---|---|---|---|---|---|---|---|---|---|---|---|---|---|---|---|---|---|---|---|---|---|---|---|---|---|
| Turnout | 28.1% ( | ||||||||||||||||||||||||||||||||||||||||||||||||
| |||||||||||||||||||||||||||||||||||||||||||||||||
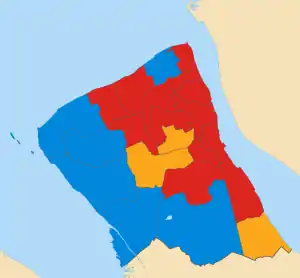 Map of results of 1998 election | |||||||||||||||||||||||||||||||||||||||||||||||||
| |||||||||||||||||||||||||||||||||||||||||||||||||
The 1998 Wirral Metropolitan Borough Council election took place on 7 May 1998 to elect members of Wirral Metropolitan Borough Council in England.[2] This election was held on the same day as other local elections.
After the election, the composition of the council was:
| Party | Seats | ± | |
|---|---|---|---|
| Labour | 41 | ||
| Conservative | 16 | ||
| Liberal Democrats | 8 | ||
| Ind. Liberal Democrat | 1 | ||
Election results
Overall election result
Overall result compared with 1996.
| Wirral Metropolitan Borough Council election results, 1998 | |||||||||||||||
|---|---|---|---|---|---|---|---|---|---|---|---|---|---|---|---|
| Party | Candidates | Votes | |||||||||||||
| Stood | Elected | Gained | Unseated | Net | % of total | % | No. | Net % | |||||||
| Labour | 24 | 13 | 0 | 0 | 59.1 | 42.1 | 29,075 | ||||||||
| Conservative | 20 | 7 | 0 | 0 | 27.3 | 33.1 | 22,856 | ||||||||
| Liberal Democrats | 24 | 4 | 0 | 0 | 13.6 | 21.4 | 14,740 | ||||||||
| Green | 18 | 0 | 0 | 0 | 0.0 | 2.8 | 1,925 | ||||||||
| Socialist Labour | 3 | 0 | 0 | 0 | 0.0 | 0.6 | 435 | N/A | |||||||
Ward results
Bebington
| Party | Candidate | Votes | % | ±% | |
|---|---|---|---|---|---|
| Labour | Kathryn Shaughnessy | 1,933 | 46.8 | ||
| Conservative | H. Gow | 1,757 | 42.6 | ||
| Liberal Democrats | Nigel Dyer | 333 | 8.1 | ||
| Green | Ann Jones | 104 | 2.5 | ||
| Majority | 176 | 4.3 | |||
| Registered electors | 10,693 | ||||
| Turnout | 38.7 | ||||
| Labour hold | Swing | ||||
Bidston
| Party | Candidate | Votes | % | ±% | |
|---|---|---|---|---|---|
| Labour | William Nock | 1,009 | 72.5 | ||
| Socialist Labour | Alec McFadden | 183 | 13.1 | New | |
| Liberal Democrats | John Tomlinson | 155 | 11.1 | ||
| Green | Robert Mitchell | 45 | 3.2 | New | |
| Majority | 826 | 59.3 | |||
| Registered electors | 7,994 | ||||
| Turnout | 17.4 | ||||
| Labour hold | Swing | ||||
Birkenhead
| Party | Candidate | Votes | % | ±% | |
|---|---|---|---|---|---|
| Labour | David Christian | 1,351 | 79.1 | ||
| Liberal Democrats | Mary Williams | 357 | 20.9 | ||
| Majority | 994 | 58.2 | |||
| Registered electors | 9,892 | ||||
| Turnout | 17.3 | ||||
| Labour hold | Swing | ||||
Bromborough
| Party | Candidate | Votes | % | ±% | |
|---|---|---|---|---|---|
| Labour | A. Witter | 1,742 | 59.8 | ||
| Conservative | Jacqueline Hall | 640 | 22.0 | ||
| Liberal Democrats | M. Bolton | 412 | 14.1 | ||
| Green | J. Jones | 120 | 4.1 | ||
| Majority | 1,102 | 37.8 | |||
| Registered electors | 10,662 | ||||
| Turnout | 27.4 | ||||
| Labour hold | Swing | ||||
Clatterbridge
| Party | Candidate | Votes | % | ±% | |
|---|---|---|---|---|---|
| Conservative | Brian Cummings | 2,344 | 48.5 | ||
| Labour | C. Riley | 1,578 | 32.7 | ||
| Liberal Democrats | Isabel Moon | 792 | 16.4 | ||
| Green | Michael Harper | 115 | 2.4 | New | |
| Majority | 766 | 15.9 | |||
| Registered electors | 13,814 | ||||
| Turnout | 35.0 | ||||
| Conservative hold | Swing | ||||
Claughton
| Party | Candidate | Votes | % | ±% | |
|---|---|---|---|---|---|
| Labour | Stephen Foulkes | 1,600 | 55.8 | ||
| Liberal Democrats | A. Molyneux | 637 | 22.2 | ||
| Conservative | K. Wise | 455 | 15.9 | ||
| Socialist Labour | Michael Cullen | 99 | 3.5 | New | |
| Green | S. Johnson | 76 | 2.7 | ||
| Majority | 963 | 33.6 | |||
| Registered electors | 10,644 | ||||
| Turnout | 26.9 | ||||
| Labour hold | Swing | ||||
Eastham
| Party | Candidate | Votes | % | ±% | |
|---|---|---|---|---|---|
| Liberal Democrats | Thomas Harney | 2,419 | 62.2 | ||
| Labour | Jean Stapleton | 937 | 24.1 | ||
| Conservative | M. Hunt | 462 | 11.9 | ||
| Green | Brian Gibbs | 72 | 1.9 | New | |
| Majority | 1,482 | 38.1 | |||
| Registered electors | 11,083 | ||||
| Turnout | 35.1 | ||||
| Liberal Democrats hold | Swing | ||||
Egerton
| Party | Candidate | Votes | % | ±% | |
|---|---|---|---|---|---|
| Labour | Barney Gilfoyle | 1,293 | 58.6 | ||
| Conservative | Cyrus Ferguson | 351 | 15.9 | ||
| Liberal Democrats | Philip Lloyd | 250 | 11.3 | ||
| Green | Catherine Page | 161 | 7.3 | ||
| Socialist Labour | Nicholas Kearns | 153 | 6.9 | New | |
| Majority | 942 | 42.7 | |||
| Registered electors | 10,461 | ||||
| Turnout | 21.1 | ||||
| Labour hold | Swing | ||||
Heswall
| Party | Candidate | Votes | % | ±% | |
|---|---|---|---|---|---|
| Conservative | Andrew Hodson [n 2] | 2,850 | 61.6 | ||
| Conservative | Stephen Rowlands [n 3] | 2,647 | – | – | |
| Labour | L. Flanaghan | 1,016 | 22.0 | ||
| Labour | A. Terry | 900 | – | – | |
| Liberal Democrats | Edward Norton | 610 | 13.2 | ||
| Liberal Democrats | Robert Wilkins | 556 | – | – | |
| Green | Garnette Bowler | 151 | 3.3 | New | |
| Majority | 1,834 | 39.6 | |||
| Registered electors | 13,214 | ||||
| Turnout | 33.7 | ||||
| Conservative hold | Swing | ||||
| Conservative hold | Swing | – | |||
Hoylake
| Party | Candidate | Votes | % | ±% | |
|---|---|---|---|---|---|
| Conservative | Gerald Ellis | 2,536 | 63.6 | ||
| Labour | E. Harrison | 817 | 20.5 | ||
| Liberal Democrats | A. Richards | 472 | 11.8 | ||
| Green | Allen Burton | 160 | 4.0 | New | |
| Majority | 1,719 | 43.1 | |||
| Registered electors | 12,130 | ||||
| Turnout | 32.4 | ||||
| Conservative hold | Swing | ||||
Leasowe
| Party | Candidate | Votes | % | ±% | |
|---|---|---|---|---|---|
| Labour | Iris Coates | 1,347 | 71.2 | ||
| Conservative | G. Beattie | 296 | 15.7 | ||
| Liberal Democrats | Susanne Uriel | 248 | 13.1 | ||
| Majority | 1,051 | 55.6 | |||
| Registered electors | 9,072 | ||||
| Turnout | 20.8 | ||||
| Labour hold | Swing | ||||
Liscard
| Party | Candidate | Votes | % | ±% | |
|---|---|---|---|---|---|
| Labour | Gordon Paterson | 1,334 | 57.8 | ||
| Conservative | J. Tooke | 569 | 24.7 | ||
| Liberal Democrats | M. Wright | 404 | 17.5 | ||
| Majority | 765 | 33.2 | |||
| Registered electors | 10,939 | ||||
| Turnout | 21.1 | ||||
| Labour hold | Swing | ||||
Moreton
| Party | Candidate | Votes | % | ±% | |
|---|---|---|---|---|---|
| Labour | M. Groves | 1,449 | 53.8 | ||
| Conservative | Ian Lewis | 977 | 36.3 | ||
| Liberal Democrats | C. Robertson | 267 | 9.9 | ||
| Majority | 472 | 17.5 | |||
| Registered electors | 9,653 | ||||
| Turnout | 27.9 | ||||
| Labour hold | Swing | ||||
New Brighton
| Party | Candidate | Votes | % | ±% | |
|---|---|---|---|---|---|
| Labour | Patrick Hackett | 1,729 | 55.7 | ||
| Conservative | Anthony Pritchard | 965 | 31.1 | ||
| Liberal Democrats | John Codling | 310 | 10.0 | ||
| Green | George Bowler | 102 | 3.3 | New | |
| Majority | 764 | 24.6 | |||
| Registered electors | 11,306 | ||||
| Turnout | 27.5 | ||||
| Labour hold | Swing | ||||
Oxton
| Party | Candidate | Votes | % | ±% | |
|---|---|---|---|---|---|
| Liberal Democrats | Stuart Kelly [n 2] | 1,913 | 54.7 | ||
| Liberal Democrats | Freda Anderson [n 3] | 1,856 | – | – | |
| Labour | Anna McLaughlin | 804 | 23.0 | ||
| Labour | Denise Roberts | 771 | – | – | |
| Conservative | Leonard Moore | 587 | 16.8 | ||
| Green | Pamela Mitchell | 193 | 5.5 | ||
| Majority | 1,109 | 31.7 | |||
| Registered electors | 11,282 | ||||
| Turnout | 27.1 | ||||
| Liberal Democrats hold | Swing | ||||
| Liberal Democrats hold | Swing | – | |||
Prenton
| Party | Candidate | Votes | % | ±% | |
|---|---|---|---|---|---|
| Liberal Democrats | John Thornton | 2,343 | 56.8 | ||
| Labour | Ray Pullen | 1,042 | 25.2 | ||
| Conservative | David Elderton | 679 | 16.5 | ||
| Green | Perle Sheldricks | 63 | 1.5 | New | |
| Majority | 1,301 | 31.5 | |||
| Registered electors | 11,320 | ||||
| Turnout | 36.5 | ||||
| Liberal Democrats hold | Swing | ||||
Royden
| Party | Candidate | Votes | % | ±% | |
|---|---|---|---|---|---|
| Conservative | Laurence Jones | 1,746 | 44.7 | ||
| Liberal Democrats | Peter Reisdorf | 1,158 | 29.7 | ||
| Labour | R. Pennington | 909 | 23.3 | ||
| Green | Barbara Burton | 89 | 2.3 | New | |
| Majority | 588 | 15.1 | |||
| Registered electors | 12,501 | ||||
| Turnout | 31.2 | ||||
| Conservative hold | Swing | ||||
Seacombe
| Party | Candidate | Votes | % | ±% | |
|---|---|---|---|---|---|
| Labour | Janet Jackson | 1,525 | 73.1 | ||
| Conservative | L. May | 280 | 13.4 | ||
| Liberal Democrats | R. Ellett | 225 | 10.8 | ||
| Green | P. Exley | 56 | 2.7 | New | |
| Majority | 1,245 | 59.7 | |||
| Registered electors | 10,743 | ||||
| Turnout | 19.4 | ||||
| Labour hold | Swing | ||||
Thurstaston
| Party | Candidate | Votes | % | ±% | |
|---|---|---|---|---|---|
| Conservative | Jacqueline McKelvie | 2,163 | 53.2 | ||
| Labour | A. Beer | 1,417 | 34.9 | ||
| Liberal Democrats | Charles Wall | 388 | 9.5 | ||
| Green | Percy Hogg | 96 | 2.4 | New | |
| Majority | 746 | 18.4 | |||
| Registered electors | 12,363 | ||||
| Turnout | 32.9 | ||||
| Conservative hold | Swing | ||||
Tranmere
| Party | Candidate | Votes | % | ±% | |
|---|---|---|---|---|---|
| Labour | William Davies | 1,328 | 81.1 | ||
| Liberal Democrats | Stephen Blaylock | 211 | 12.9 | ||
| Green | Angela Upton | 98 | 6.0 | ||
| Majority | 1,117 | 68.2 | |||
| Registered electors | 9,380 | ||||
| Turnout | 17.5 | ||||
| Labour hold | Swing | ||||
Upton
| Party | Candidate | Votes | % | ±% | |
|---|---|---|---|---|---|
| Labour | Hugh Lloyd | 1,790 | 53.6 | ||
| Conservative | John Laing | 1,034 | 31.0 | ||
| Liberal Democrats | Michael Redfern | 421 | 12.6 | ||
| Green | Joyce Hogg | 94 | 2.8 | New | |
| Majority | 756 | 22.6 | |||
| Registered electors | 12,375 | ||||
| Turnout | 27.0 | ||||
| Labour hold | Swing | ||||
Wallasey
| Party | Candidate | Votes | % | ±% | |
|---|---|---|---|---|---|
| Conservative | Lesley Rennie | 2,165 | 56.5 | ||
| Labour | P. Carrington | 1,125 | 29.3 | ||
| Liberal Democrats | John Uriel | 415 | 10.8 | ||
| Green | George Bowler | 130 | 3.4 | New | |
| Majority | 1,040 | 27.1 | |||
| Turnout | 32.9 | ||||
| Conservative hold | Swing | ||||
Changes between 1998 and 1999
| Date | Ward | Name | Previous affiliation | New affiliation | Circumstance | ||
|---|---|---|---|---|---|---|---|
| June 1998 | Prenton | Ed Cunniffe | Ind. Liberal Democrat | Labour | Defected.[20] | ||
Notes
• italics denote the sitting councillor • bold denotes the winning candidate
References
- 1 2 "Local Election Summaries 1998". The Elections Centre. Retrieved 26 December 2018.
- 1 2 3 4 5 6 7 8 9 10 11 12 13 14 15 16 17 18 19 20 21 22 23 24 "Metropolitan Borough of Wirral Election Results 1973-2012 (Pg. 14 and 15)" (PDF). The Elections Centre. Retrieved 26 December 2018.
- ↑ "Council compositions". The Elections Centre. Retrieved 27 July 2018.
- ↑ "Councillor Steve Foulkes". Wirral Metropolitan Borough Council. 2 August 2023.
- ↑ "Councillor Tom Harney". Wirral Metropolitan Borough Council.
- ↑ "Councillor Jean Stapleton". Wirral Metropolitan Borough Council.
- ↑ "Councillor Andrew Hodson". Wirral Metropolitan Borough Council. 2 August 2023.
- ↑ "Councillor Les Rowlands". Wirral Metropolitan Borough Council.
- ↑ "Councillor Bob Wilkins". Wirral Metropolitan Borough Council. Archived from the original on 5 July 2018. Retrieved 27 January 2019.
- ↑ "Councillor Gerry Ellis". Wirral Metropolitan Borough Council.
- ↑ "Councillor Ian Lewis". Wirral Metropolitan Borough Council. 2 August 2023.
- ↑ "Councillor Pat Hackett". Wirral Metropolitan Borough Council.
- ↑ "Councillor Tony Pritchard". Wirral Metropolitan Borough Council.
- ↑ "Councillor Stuart Kelly". Wirral Metropolitan Borough Council. 2 August 2023.
- ↑ "Councillor Denise Roberts". Wirral Metropolitan Borough Council.
- ↑ "Councillor David M Elderton". Wirral Metropolitan Borough Council.
- ↑ "Councillor Peter Reisdorf". Wirral Metropolitan Borough Council.
- ↑ "Councillor Bill Davies". Wirral Metropolitan Borough Council. Archived from the original on 12 June 2018. Retrieved 28 January 2019.
- ↑ "Councillor Lesley Rennie". Wirral Metropolitan Borough Council. 2 August 2023.
- ↑ "Lib Dem councillor switches sides". Wirral Globe. 17 June 1998. Retrieved 28 December 2018.
"Socialist Labour candidates". Wirral Globe. 23 April 1998. Retrieved 30 December 2018.
This article is issued from Wikipedia. The text is licensed under Creative Commons - Attribution - Sharealike. Additional terms may apply for the media files.