| |||||||||||||||||||||
One third of seats to Bassetlaw District Council (16 seats) 25 seats needed for a majority | |||||||||||||||||||||
|---|---|---|---|---|---|---|---|---|---|---|---|---|---|---|---|---|---|---|---|---|---|
| Turnout | 32.1% | ||||||||||||||||||||
| |||||||||||||||||||||
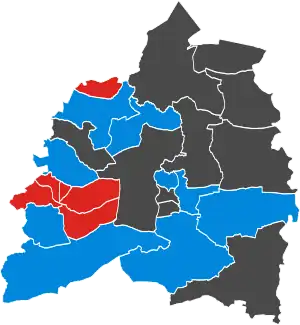 No election Colours denote the winning party, as shown in the main table of results. | |||||||||||||||||||||
| |||||||||||||||||||||
The 2007 Bassetlaw District Council election took place on 3 May 2007 to elect members of Bassetlaw District Council in Nottinghamshire, England. One third of the council was up for election.
Election result
The Conservative Party retained control of the council, winning nine of sixteen seats up for election, and twenty-seven seats overall. Notably, the Liberal Democrats lost their only seat on the council to the Conservatives in the Ranskill ward.
| Overall result | ||||
|---|---|---|---|---|
| Party | Seats (2007) |
Seats (Council) |
Seats (Change) | |
| Conservative | 9 | 27 | -1 | |
| Labour | 6 | 16 | +2 | |
| Independent | 1 | 5 | - | |
| Registered electors | 62,838 | |||
| Votes cast | 20,181 | |||
| Turnout | 32.1% | |||
Ward results
Blyth
| Party | Candidate | Votes | % | ±% | |
|---|---|---|---|---|---|
| Conservative | Terry Yates | 509 | 74.7% | ||
| Labour | Peter Abell | 172 | 25.3% | ||
| Turnout | 681 | 38.4% | |||
| Registered electors | 1,801 | ||||
Carlton
| Party | Candidate | Votes | % | ±% | |
|---|---|---|---|---|---|
| Conservative | David Hare | 903 | 52.0% | ||
| Labour | Gary Moore | 832 | 48.0% | ||
| Turnout | 1,735 | 37.3% | |||
| Registered electors | 4,663 | ||||
East Markham
| Party | Candidate | Votes | % | ±% | |
|---|---|---|---|---|---|
| Conservative | John Ogle | 734 | 83.5% | ||
| Labour | Roderick Pickford | 145 | 16.5% | ||
| Turnout | 879 | 47.7% | |||
| Registered electors | 1,843 | ||||
East Retford East
| Party | Candidate | Votes | % | ±% | |
|---|---|---|---|---|---|
| Conservative | Jim Holland | 1,197 | 67.5% | ||
| Labour | Pam Skelding | 577 | 32.5% | ||
| Turnout | 1,774 | 32.9% | |||
| Registered electors | 5,483 | ||||
East Retford North
| Party | Candidate | Votes | % | ±% | |
|---|---|---|---|---|---|
| Conservative | Mike Pugsley | 1,094 | 61.4% | ||
| Labour | Vaughan Thomas | 689 | 38.6% | ||
| Turnout | 1,783 | 37.7% | |||
| Registered electors | 4,801 | ||||
Harworth
| Party | Candidate | Votes | % | ±% | |
|---|---|---|---|---|---|
| Labour | John Clayton | 1,066 | 71.2% | ||
| Conservative | Carole Mangham | 431 | 28.8% | ||
| Turnout | 1,497 | 25.9% | |||
| Registered electors | 5,800 | ||||
Rampton
| Party | Candidate | Votes | % | ±% | |
|---|---|---|---|---|---|
| Conservative | Jeffery Rickells | Unopposed | |||
Ranskill
| Party | Candidate | Votes | % | ±% | |
|---|---|---|---|---|---|
| Conservative | Michael Gray | 392 | 57.2% | ||
| Labour | Viv Thomas | 152 | 22.2% | ||
| Liberal Democrats | Mark Hunter | 141 | 20.6% | ||
| Turnout | 685 | 38.2% | |||
| Registered electors | 1,776 | ||||
Sturton
| Party | Candidate | Votes | % | ±% | |
|---|---|---|---|---|---|
| Independent | Hugh Burton | 640 | 83.6% | ||
| Labour | Cadell Thomas | 126 | 16.4% | ||
| Turnout | 766 | 43.4% | |||
| Registered electors | 1,775 | ||||
Welbeck
| Party | Candidate | Votes | % | ±% | |
|---|---|---|---|---|---|
| Conservative | Mary Stokes | 401 | 59.1% | ||
| Labour | Robin Carrington-Wilde | 277 | 40.9% | ||
| Turnout | 678 | 41.1% | |||
| Registered electors | 1,661 | ||||
Worksop East
| Party | Candidate | Votes | % | ±% | |
|---|---|---|---|---|---|
| Labour | Cliff Entwistle | 953 | 57.9% | ||
| Independent | Martin Introna | 692 | 42.1% | ||
| Turnout | 1,645 | 32.5% | |||
| Registered electors | 5,071 | ||||
Worksop North
| Party | Candidate | Votes | % | ±% | |
|---|---|---|---|---|---|
| Labour | Bill Barker | 981 | 55.2% | ||
| Conservative | Vicky Wanless | 795 | 44.8% | ||
| Turnout | 1,776 | 27.8% | |||
| Registered electors | 6,412 | ||||
Worksop North East
| Party | Candidate | Votes | % | ±% | |
|---|---|---|---|---|---|
| Labour | Simon Greaves | 905 | 52.6% | ||
| Conservative | Barry Bowles | 816 | 47.4% | ||
| Turnout | 1,721 | 34.2% | |||
| Registered electors | 5,084 | ||||
Worksop North West
| Party | Candidate | Votes | % | ±% | |
|---|---|---|---|---|---|
| Labour | Alan Rhodes | 893 | 59.0% | ||
| Conservative | Tracey Taylor | 621 | 41.0% | ||
| Turnout | 1,514 | 27.5% | |||
| Registered electors | 5,553 | ||||
Worksop South
| Party | Candidate | Votes | % | ±% | |
|---|---|---|---|---|---|
| Conservative | Julie Smith | 1,217 | 67.5% | ||
| Labour | Mick Golding | 587 | 32.5% | ||
| Turnout | 1,804 | 33.5% | |||
| Registered electors | 5,466 | ||||
Worksop South East
| Party | Candidate | Votes | % | ±% | |
|---|---|---|---|---|---|
| Labour | Josie Potts | 917 | 73.8% | ||
| Conservative | Philip Smith | 326 | 26.2% | ||
| Turnout | 1,243 | 22.3% | |||
| Registered electors | 5,649 | ||||
References
This article is issued from Wikipedia. The text is licensed under Creative Commons - Attribution - Sharealike. Additional terms may apply for the media files.