Bajo Baudó | |
|---|---|
Municipality and town | |
.svg.png.webp) Flag | |
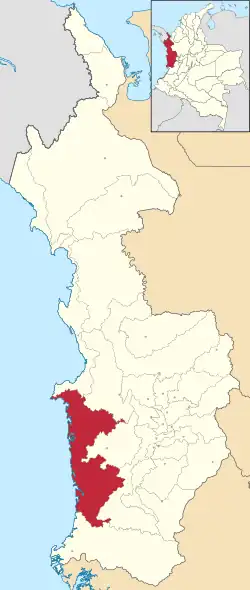 Location of the municipality and town of Bajo Baudó in the Chocó Department of Colombia. | |
| Coordinates: 4°57′N 77°22′W / 4.950°N 77.367°W | |
| Country | |
| Department | Chocó Department |
| Founded | 1821 |
| Area | |
| • Total | 4,840 km2 (1,870 sq mi) |
| Elevation | 12 m (39 ft) |
| Population (Census 2018[1]) | |
| • Total | 18,561 |
| • Density | 3.8/km2 (9.9/sq mi) |
| Demonym | Bajobaudoseño |
| Time zone | UTC-5 (Colombia Standard Time) |
| Area code | 57-4 |
| Website | Official website (in Spanish) |
Bajo Baudó (Spanish pronunciation: [ˈbaxo βawˈðo]) is a municipality and town in the Chocó Department, Colombia. It was founded in 1821 and converted into a municipality in 1825. Most of the town's population of 16,375 live in rural areas.
Climate
Bajo Baudó has a very wet tropical rainforest climate (Af) with very heavy to extremely heavy rainfall year-round.
| Climate data for Bajo Baudó | |||||||||||||
|---|---|---|---|---|---|---|---|---|---|---|---|---|---|
| Month | Jan | Feb | Mar | Apr | May | Jun | Jul | Aug | Sep | Oct | Nov | Dec | Year |
| Mean daily maximum °C (°F) | 29.8 (85.6) |
29.9 (85.8) |
30.3 (86.5) |
30.4 (86.7) |
30.3 (86.5) |
30.0 (86.0) |
30.0 (86.0) |
29.6 (85.3) |
29.3 (84.7) |
28.9 (84.0) |
29.0 (84.2) |
29.3 (84.7) |
29.7 (85.5) |
| Daily mean °C (°F) | 26.0 (78.8) |
26.0 (78.8) |
26.3 (79.3) |
26.5 (79.7) |
26.4 (79.5) |
26.2 (79.2) |
26.2 (79.2) |
25.0 (77.0) |
25.7 (78.3) |
25.5 (77.9) |
25.5 (77.9) |
25.8 (78.4) |
25.9 (78.7) |
| Mean daily minimum °C (°F) | 22.3 (72.1) |
22.2 (72.0) |
22.4 (72.3) |
22.6 (72.7) |
22.6 (72.7) |
22.4 (72.3) |
22.4 (72.3) |
22.3 (72.1) |
22.2 (72.0) |
22.2 (72.0) |
22.1 (71.8) |
22.3 (72.1) |
22.3 (72.2) |
| Average rainfall mm (inches) | 429 (16.9) |
329 (13.0) |
385 (15.2) |
485 (19.1) |
576 (22.7) |
615 (24.2) |
610 (24.0) |
731 (28.8) |
676 (26.6) |
702 (27.6) |
643 (25.3) |
525 (20.7) |
6,706 (264.1) |
| Source: Climate-Data.org[2] | |||||||||||||
External links
- Official website (in Spanish)
References
- ↑ "Censo Nacional de Población y Vivienda 2018" (in Spanish). DANE. Retrieved 26 April 2020.
- ↑ "Climate: Bajo Baudó". Climate-Data.org. Retrieved September 9, 2020.
This article is issued from Wikipedia. The text is licensed under Creative Commons - Attribution - Sharealike. Additional terms may apply for the media files.