| Delaware's at-large congressional district | |||
|---|---|---|---|
 | |||
| Representative |
| ||
| Area | 2,489 sq mi (6,450 km2) | ||
| Distribution |
| ||
| Population (2022) | 1,018,396 | ||
| Median household income | $82,174[2] | ||
| Ethnicity |
| ||
| Cook PVI | D+7[3] | ||
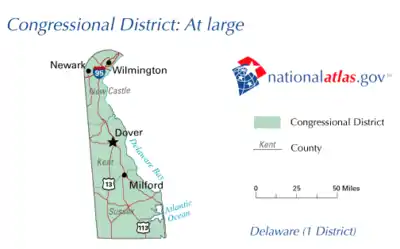
Delaware's at-large congressional district is a congressional district that includes the entire U.S. state of Delaware. It is the nation's oldest congressional district, having existed uninterrupted since the 1st United States Congress in 1789. It is also the most populous congressional district in the nation. Delaware has always had only one member of the United States House of Representatives, except for a single decade from 1813 and 1823, when the state had two at-large members. The two seats were filled by a statewide ballot, with the two candidates receiving the highest votes being elected.
Mike Castle, a Republican and former governor of Delaware, held this seat from January 1993 until his retirement in January 2011, after his unsuccessful bid for the Republican nomination to run for U.S. Senator. Even as Delaware swung heavily Democratic at the state and national level, Castle was usually reelected without serious difficulty. Since his retirement, however, the Democrats have held it with no substantive opposition.
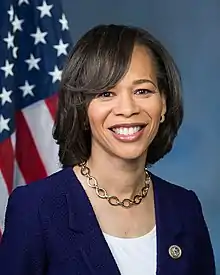
The district is currently represented by Lisa Blunt Rochester, a Democrat.
Recent statewide results
| Year | Office | Results |
|---|---|---|
| 1992 | President | B. Clinton 44–35% |
| 1996 | President | B. Clinton 52–37% |
| 2000 | President | Gore 55–42% |
| 2004 | President | Kerry 53–45% |
| 2008 | President | Obama 61–36% |
| 2012 | President | Obama 59–40% |
| 2016 | President | H. Clinton 53–42% |
| 2020 | President | Biden 59–40% |
List of members representing the district

.jpg.webp)

.jpg.webp)
.jpg.webp)
.jpg.webp)
.jpg.webp)
.jpg.webp)
.jpg.webp)
.jpg.webp)
.jpg.webp)
.jpg.webp)

Second at-large seat: 1813–1823
From 1813 to 1823, Delaware elected two members of the United States House of Representatives. Both were elected statewide at-large. Four men held the second seat during that decade.
| Member | Party | Years | Cong ress |
Electoral history |
|---|---|---|---|---|
| Thomas Cooper (Georgetown) |
Federalist | March 4, 1813 – March 3, 1817 |
13th 14th |
Elected in 1812. Re-elected in 1814. Lost re-election. |
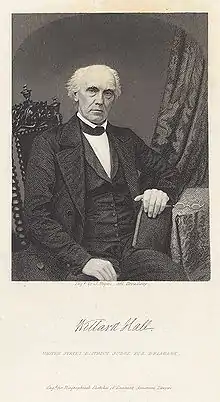 Willard Hall (Dover) |
Democratic- Republican |
March 4, 1817 – January 22, 1821 |
15th 16th |
Elected in 1816. Re-elected in 1818. Lost re-election and resigned early. |
| Vacant | January 22, 1821 – March 3, 1821 |
16th | ||
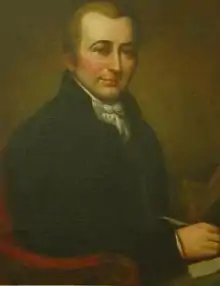 Caesar Augustus Rodney (Wilmington) |
Democratic- Republican |
March 4, 1821 – January 24, 1822 |
17th | Elected in 1820. Resigned when elected U.S. senator. |
| Vacant | January 24, 1822 – October 1, 1822 |
|||
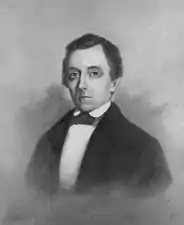 Daniel Rodney (Lewes) |
Federalist | October 1, 1822 – March 3, 1823 |
Elected to finish his cousin's term. Retired. | |
Electoral history
1920
| Party | Candidate | Votes | % | |
|---|---|---|---|---|
| Republican | Caleb R. Layton (Incumbent) | 52,145 | 56% | |
| Democratic | James R. Clements | 40,206 | 43% | |
| Socialist | Robert A. Walker | 1,063 | .01% | |
| Independent | Howard T. Ennis | 196 | .02% | |
| Total votes | 93,609 | 100% | ||
| Turnout | ||||
| Republican hold | ||||
1922
| Party | Candidate | Votes | % | |||
|---|---|---|---|---|---|---|
| Democratic | William H. Boyce | 39,126 | 54% | |||
| Republican | Caleb R. Layton (Incumbent) | 32,577 | 45% | |||
| Independent | Frank A. Houck | 908 | .01% | |||
| Total votes | 72,611 | 100% | ||||
| Turnout | ||||||
| Democratic gain from Republican | ||||||
1924
| Party | Candidate | Votes | % | |||
|---|---|---|---|---|---|---|
| Republican | Robert G. Houston | 51,536 | 59% | |||
| Democratic | William H. Boyce (incumbent) | 35,943 | 41% | |||
| Independent | Florence Garvin | 519 | 0.05 | |||
| Total votes | 87,998 | 100% | ||||
| Turnout | ||||||
| Republican gain from Democratic | ||||||
1926
| Party | Candidate | Votes | % | |
|---|---|---|---|---|
| Republican | Robert G. Houston (incumbent) | 38,919 | 52% | |
| Democratic | Merrill H. Tilghman | 35,943 | 48% | |
| Total votes | 74,862 | 100% | ||
| Turnout | ||||
| Republican hold | ||||
1928
| Party | Candidate | Votes | % | |
|---|---|---|---|---|
| Republican | Robert G. Houston (incumbent) | 66,361 | 64% | |
| Democratic | John M. Richardson | 38,045 | 36% | |
| Total votes | 104,406 | 100% | ||
| Turnout | ||||
| Republican hold | ||||
1930
| Party | Candidate | Votes | % | |
|---|---|---|---|---|
| Republican | Robert G. Houston (incumbent) | 48,493 | 56% | |
| Democratic | John P. Le Fevre | 38,391 | 44% | |
| Independent | Arnold Williams | 127 | 0.01% | |
| Total votes | 87,011 | 100% | ||
| Turnout | ||||
| Republican hold | ||||
1932
| Party | Candidate | Votes | % | |||
|---|---|---|---|---|---|---|
| Democratic | Wilbur L. Adams | 51,698 | 46% | |||
| Republican | Reuben Satterthwaite Jr. | 48,841 | 44% | |||
| Prohibition | Francis B. Short | 10,560 | 9% | |||
| Socialist | Edgar G. Shaeffer | 887 | 0.08% | |||
| Communist | Frank Rhoades | 110 | 0.01% | |||
| Total votes | 112,096 | 100% | ||||
| Turnout | ||||||
| Democratic gain from Republican | ||||||
1934
| Party | Candidate | Votes | % | |||
|---|---|---|---|---|---|---|
| Republican | J. George Stewart | 52,829 | 53% | |||
| Democratic | John C. Hazzard | 45,771 | 46% | |||
| Socialist | William A. Mayor | 404 | 0.4% | |||
| Communist | Joseph P. Daniels | 58 | .006% | |||
| Total votes | 99,062 | 100% | ||||
| Turnout | ||||||
| Republican gain from Democratic | ||||||
1936
| Party | Candidate | Votes | % | |||
|---|---|---|---|---|---|---|
| Democratic | William F. Allen | 65,485 | 52% | |||
| Republican | J. George Stewart (incumbent) | 55,664 | 44% | |||
| Republican | James A. Ellison | 5,338 | 4% | |||
| Socialist | William A. Mayor | 176 | 0.01% | |||
| Total votes | 126,663 | 100% | ||||
| Turnout | ||||||
| Democratic gain from Republican | ||||||
1938
| Party | Candidate | Votes | % | |||
|---|---|---|---|---|---|---|
| Republican | George S. Williams | 60,661 | 56% | |||
| Democratic | William F. Allen (incumbent) | 46,989 | 43% | |||
| Republican | William J. Highfield | 816 | 0.07% | |||
| Progressive | Ralph L. Brown | 105 | 0.01% | |||
| Total votes | 108,571 | 100% | ||||
| Turnout | ||||||
| Republican gain from Democratic | ||||||
1940
| Party | Candidate | Votes | % | |||
|---|---|---|---|---|---|---|
| Democratic | Philip A. Traynor | 68,205 | 51% | |||
| Republican | George S. Williams (incumbent) | 64,384 | 48% | |||
| Independent | Royden C. Caulk | 816 | 0.06% | |||
| Total votes | 133,405 | 100% | ||||
| Turnout | ||||||
| Democratic gain from Republican | ||||||
1980
| Party | Candidate | Votes | % | |
|---|---|---|---|---|
| Republican | Tom Evans (incumbent) | 133,842 | 62% | |
| Democratic | Robert Maxwell | 81,227 | 37% | |
| Libertarian | Lawrence Sullivan | 1,506 | 1% | |
| Total votes | 216,575 | 100% | ||
| Republican hold | ||||
1982
| Party | Candidate | Votes | % | |||
|---|---|---|---|---|---|---|
| Democratic | Thomas R. Carper | 98,533 | 52% | |||
| Republican | Tom Evans (incumbent) | 87,153 | 46% | |||
| American | Mary Gies | 1,109 | 1% | |||
| Libertarian | Richard Cohen | 711 | 0.38% | |||
| N/A | David Nuttall | 558 | 0.30% | |||
| Total votes | 188,064 | 100% | ||||
| Democratic gain from Republican | ||||||
1984
| Party | Candidate | Votes | % | |
|---|---|---|---|---|
| Democratic | Thomas R. Carper (incumbent) | 142,070 | 58% | |
| Republican | Elise du Pont | 100,650 | 41% | |
| Libertarian | V. Luther Etzel | 294 | 0.12% | |
| Total votes | 243,014 | 100% | ||
| Democratic hold | ||||
1986
| Party | Candidate | Votes | % | |
|---|---|---|---|---|
| Democratic | Thomas R. Carper (incumbent) | 106,351 | 66% | |
| Republican | Thomas Nueberger | 53,767 | 33% | |
| American | Patrick Harrison | 639 | 0.40% | |
| Total votes | 160,757 | 100% | ||
| Democratic hold | ||||
1988
| Party | Candidate | Votes | % | |
|---|---|---|---|---|
| Democratic | Thomas R. Carper (incumbent) | 158,338 | 68% | |
| Republican | James P. Krapf | 76,179 | 32% | |
| Total votes | 234,517 | 100% | ||
| Democratic hold | ||||
1990
| Party | Candidate | Votes | % | |
|---|---|---|---|---|
| Democratic | Thomas R. Carper (incumbent) | 116,274 | 66% | |
| Republican | Ralph Williams | 58,037 | 33% | |
| Libertarian | Richard Cohen | 3,121 | 1% | |
| N/A | Write-ins | 3 | <0.01% | |
| Total votes | 177,435 | 100% | ||
| Democratic hold | ||||
1992
| Party | Candidate | Votes | % | |||
|---|---|---|---|---|---|---|
| Republican | Mike Castle | 153,037 | 55% | |||
| Democratic | S. B. Woo | 117,426 | 43% | |||
| Libertarian | Peggy Schmitt | 5,661 | 2% | |||
| Total votes | 276,124 | 100% | ||||
| Republican gain from Democratic | ||||||
1994
| Party | Candidate | Votes | % | |
|---|---|---|---|---|
| Republican | Mike Castle (incumbent) | 137,945 | 71% | |
| Democratic | Carol Ann DeSantis | 51,793 | 27% | |
| Libertarian | Danny Ray Beaver | 3,866 | 2% | |
| Independent | Donald M. Hockmuth | 1,404 | 0.72% | |
| Total votes | 195,008 | 100% | ||
| Republican hold | ||||
1996
| Party | Candidate | Votes | % | |
|---|---|---|---|---|
| Republican | Mike Castle (incumbent) | 185,577 | 70% | |
| Democratic | Dennis E. Williams | 73,258 | 27% | |
| Libertarian | George A. Jurgensen | 4,000 | 2% | |
| Constitution | Felicia B. Johnson | 3,009 | 1% | |
| Natural Law | Bob Mattson | 987 | 0.37% | |
| Total votes | 266,831 | 100% | ||
| Republican hold | ||||
1998
| Party | Candidate | Votes | % | |
|---|---|---|---|---|
| Republican | Mike Castle (incumbent) | 119,811 | 66% | |
| Democratic | Dennis E. Williams | 57,446 | 32% | |
| Constitution | James P. Webster | 2,411 | 1% | |
| Natural Law | Kim Stanley Bemis | 859 | 1% | |
| N/A | Write-ins | 2 | <0.01% | |
| Total votes | 180,529 | 100% | ||
| Republican hold | ||||
2000
| Party | Candidate | Votes | % | |
|---|---|---|---|---|
| Republican | Mike Castle (incumbent) | 211,797 | 68% | |
| Democratic | Micheal C. Miller | 96,488 | 31% | |
| Constitution | James P. Webster | 2,490 | 0.5% | |
| Libertarian | Brad C. Thomas | 2,351 | 0.5% | |
| Total votes | 313,126 | 100% | ||
| Republican hold | ||||
2002
| Party | Candidate | Votes | % | |
|---|---|---|---|---|
| Republican | Mike Castle (incumbent) | 164,605 | 72% | |
| Democratic | Micheal C. Miller | 61,011 | 27% | |
| Libertarian | Brad C. Thomas | 2,789 | 1% | |
| Total votes | 228,405 | 100% | ||
| Republican hold | ||||
2004
| Party | Candidate | Votes | % | |
|---|---|---|---|---|
| Republican | Mike Castle (incumbent) | 245,978 | 69% | |
| Democratic | Paul Donnelly | 105,716 | 30% | |
| Independent | Maurice J. Barros (write-in) | 2,337 | 0.5% | |
| Libertarian | William E. Morris | 2,014 | 0.5% | |
| Total votes | 356,045 | 100% | ||
| Republican hold | ||||
2006
| Party | Candidate | Votes | % | |
|---|---|---|---|---|
| Republican | Mike Castle (incumbent) | 143,897 | 57% | |
| Democratic | Dennis Spivack | 97,565 | 39% | |
| Independent | Karen M. Hartley-Nagle | 5,769 | 2% | |
| Green | Michael Berg | 4,463 | 2% | |
| Total votes | 251,694 | 100% | ||
| Republican hold | ||||
2008
| Party | Candidate | Votes | % | |
|---|---|---|---|---|
| Republican | Michael Castle (incumbent) | 235,437 | 61% | |
| Democratic | Karen Hartley-Nagle | 146,434 | 38% | |
| Libertarian | Mark Parks | 3,586 | 1% | |
| Total votes | 385,457 | 100% | ||
| Republican hold | ||||
2010
| Party | Candidate | Votes | % | |||
|---|---|---|---|---|---|---|
| Democratic | John Carney | 173,543 | 57% | |||
| Republican | Glen Urquhart | 125,442 | 41% | |||
| Independent | Earl R. Lofland | 3,704 | 1% | |||
| Libertarian | Brent Wangen | 1,986 | 1% | |||
| Independent | Jeffrey Brown | 961 | 0.31% | |||
| Total votes | 305,636 | 100% | ||||
| Turnout | ||||||
| Democratic gain from Republican | ||||||
2012
| Party | Candidate | Votes | % | |
|---|---|---|---|---|
| Democratic | John Carney (incumbent) | 249,905 | 64% | |
| Republican | Tom Kovach | 129,749 | 33% | |
| Green | Bernard August | 4,273 | 2% | |
| Libertarian | Scott Gesty | 4,096 | 1% | |
| Total votes | 388,023 | 100% | ||
| Democratic hold | ||||
2014
| Party | Candidate | Votes | % | |
|---|---|---|---|---|
| Democratic | John Carney (incumbent) | 137,251 | 59% | |
| Republican | Rose Izzo | 85,146 | 37% | |
| Green | Bernard August | 4,801 | 2% | |
| Libertarian | Scott Gesty | 4,419 | 2% | |
| Total votes | 231,617 | 100% | ||
| Democratic hold | ||||
2016
| Party | Candidate | Votes | % | |
|---|---|---|---|---|
| Democratic | Lisa Blunt Rochester | 233,554 | 56% | |
| Republican | Hans Reigle | 172,301 | 41% | |
| Green | Mark Andrew Perri | 8,326 | 2% | |
| Libertarian | Scott Gesty | 6,436 | 2% | |
| Total votes | 420,617 | 100% | ||
| Democratic hold | ||||
2018
| Party | Candidate | Votes | % | |
|---|---|---|---|---|
| Democratic | Lisa Blunt Rochester (incumbent) | 227,353 | 64.5% | |
| Republican | Scott Walker | 125,384 | 35.5% | |
| Turnout | 352,737 | 46.1% | ||
| Total votes | 352,737 | 100% | ||
| Democratic hold | ||||
2020
| Party | Candidate | Votes | % | ||
|---|---|---|---|---|---|
| Democratic | Lisa Blunt Rochester (incumbent) | 281,382 | 57.6% | ||
| Republican | Lee Murphy | 196,392 | 40.2% | ||
| Independent | Catherine S. Purcell | 6,682 | 1.3% | ||
| Libertarian | David L. Rogers | 3,814 | 0.7% | ||
| Turnout | |||||
| Total votes | 488,270 | 100% | |||
| Democratic hold | |||||
2022
| Party | Candidate | Votes | % | ||
|---|---|---|---|---|---|
| Democratic | Lisa Blunt Rochester (incumbent) | 178,416 | 55.4% | ||
| Republican | Lee Murphy | 138,201 | 42.9% | ||
| Libertarian | Cody McNutt | 3,074 | 0.9% | ||
| Non-Partisan Delaware | David Rogers | 1,958 | 0.6% | ||
| Total votes | 321,568 | 100% | |||
| Democratic hold | |||||
Notes
- ↑ Supported the Crawford faction in the 1824 United States presidential election
References
- Barone, Michael; Richard E. Cohen (2005). The Almanac of American Politics. Washington: National Journal Group. ISBN 0-89234-112-2.
- Martin, Roger A. (1995). Memoirs of the Senate. Newark, DE: Roger A. Martin.
- ↑ "Urban Rural Population United States in 2010 – Distribution". Statista. Archived from the original on February 1, 2018. Retrieved May 7, 2018.
- ↑ "My Congressional District".
- ↑ "2022 Cook PVI: District Map and List". The Cook Political Report. July 12, 2022. Retrieved January 7, 2023.
- ↑ Representatives, Office of the Clerk, U.S. House of. "Office of the Clerk of the U.S. House of Representatives – 404". clerk.house.gov. Archived from the original on March 25, 2016. Retrieved May 7, 2018.
{{cite web}}: CS1 maint: multiple names: authors list (link) - ↑ Representatives, Office of the Clerk, U.S. House of. "Office of the Clerk of the U.S. House of Representatives – 404". clerk.house.gov. Archived from the original on March 4, 2016. Retrieved May 7, 2018.
{{cite web}}: CS1 maint: multiple names: authors list (link) - ↑ Representatives, Office of the Clerk, U.S. House of. "Office of the Clerk of the U.S. House of Representatives – 404". clerk.house.gov. Archived from the original on February 27, 2015. Retrieved May 7, 2018.
{{cite web}}: CS1 maint: multiple names: authors list (link) - ↑ Representatives, Office of the Clerk, U.S. House of. "Office of the Clerk of the U.S. House of Representatives – 404". clerk.house.gov. Archived from the original on March 25, 2016. Retrieved May 7, 2018.
{{cite web}}: CS1 maint: multiple names: authors list (link) - ↑ Representatives, Office of the Clerk, U.S. House of. "Office of the Clerk of the U.S. House of Representatives – 404". clerk.house.gov. Archived from the original on March 17, 2016. Retrieved May 7, 2018.
{{cite web}}: CS1 maint: multiple names: authors list (link) - ↑ Representatives, Office of the Clerk, U.S. House of. "Office of the Clerk of the U.S. House of Representatives – 404". clerk.house.gov. Archived from the original on March 24, 2016. Retrieved May 7, 2018.
{{cite web}}: CS1 maint: multiple names: authors list (link) - ↑ Representatives, Office of the Clerk, U.S. House of. "Office of the Clerk of the U.S. House of Representatives – 404". clerk.house.gov. Archived from the original on March 26, 2016. Retrieved May 7, 2018.
{{cite web}}: CS1 maint: multiple names: authors list (link) - ↑ Representatives, Office of the Clerk, U.S. House of. "Office of the Clerk of the U.S. House of Representatives – 404". clerk.house.gov. Archived from the original on March 4, 2016. Retrieved May 7, 2018.
{{cite web}}: CS1 maint: multiple names: authors list (link) - ↑ Representatives, Office of the Clerk, U.S. House of. "Office of the Clerk of the U.S. House of Representatives – 404". clerk.house.gov. Archived from the original on June 10, 2011. Retrieved May 7, 2018.
{{cite web}}: CS1 maint: multiple names: authors list (link) - ↑ Representatives, Office of the Clerk, U.S. House of. "Office of the Clerk of the U.S. House of Representatives – 404". clerk.house.gov. Archived from the original on June 10, 2011. Retrieved May 7, 2018.
{{cite web}}: CS1 maint: multiple names: authors list (link) - ↑ "2000 ELECTION STATISTICS". clerk.house.gov. Archived from the original on July 21, 2011. Retrieved May 7, 2018.
- ↑ "2002 ELECTION STATISTICS". clerk.house.gov. Archived from the original on January 5, 2007. Retrieved May 7, 2018.
- ↑ "2004 ELECTION STATISTICS". clerk.house.gov. Archived from the original on June 10, 2011. Retrieved May 7, 2018.
- ↑ "2006 Election Statistics". clerk.house.gov. Archived from the original on January 30, 2008. Retrieved May 7, 2018.
- ↑ "State of Delaware Primary Election Official Results". State of Delaware. Archived from the original on November 7, 2012. Retrieved November 7, 2012.
- 1 2 3 "State of Delaware General Election (Official Results)". State of Delaware Election Commissioner. Archived from the original on November 26, 2014. Retrieved November 27, 2014.
- ↑ "2022 General Election Report". Delaware Department of Elections.
External links
- "Our Campaigns - United States - Delaware - DE - At-Large". www.ourcampaigns.com. Retrieved January 14, 2021.