Eastern | |
|---|---|
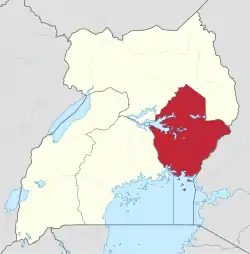 Location of Jinja in Eastern region, Uganda | |
| Coordinates: 00°25′N 033°12′E / 0.417°N 33.200°E | |
| Country | Uganda |
| Region | Eastern |
| Regional capital | Jinja |
| Area | |
| • Total | 39,478.8 km2 (15,242.8 sq mi) |
| Elevation | 1,143 m (3,750 ft) |
| Population (2014 census)[2] | |
| • Total | 9,042,422 |
| • Estimate (2011) | 8,623,300 |
| • Density | 230/km2 (590/sq mi) |
| Time zone | UTC+3 (EAT) |
| HDI (2019) | 0.544[3] low · 2nd |
The Eastern region is one of four regions in the country of Uganda.[1] As of Uganda's 2014 census, the region's population was 9,042,422.[2]
Districts
As of 2010, the Eastern Region contained 32 districts:[2]

Eastern region in green.
| District | Population (Census 1991) | Population (Census 2002) | Population (Census 2014) | Map | Chief town |
|---|---|---|---|---|---|
| Amuria | 69,353 | 180,022 | 270,928 | 4 | Amuria |
| Budaka | 100,348 | 136,489 | 207,597 | 7 | Budaka |
| Bududa | 79,218 | 123,103 | 210,173 | 49 | Bududa |
| Bugiri | 171,269 | 266,944 | 382,913 | 8 | Bugiri |
| Bukedea | 75,272 | 122,433 | 203,600 | 83 | Bukedea |
| Bukwa | 30,692 | 48,952 | 89,356 | 9 | Bukwa |
| Bulambuli | 64,576 | 97,273 | 174,508 | 85 | Bulambuli |
| Busia | 163,597 | 225,008 | 323,662 | 13 | Busia |
| Butaleja | 106,678 | 157,489 | 244,153 | 15 | Butaleja |
| Buyende | 130,775 | 191,266 | 323,067 | 88 | Buyende |
| Iganga | 235,348 | 355,473 | 504,197 | 20 | Iganga |
| Jinja | 289,476 | 387,573 | 471,242 | 21 | Jinja |
| Kaberamaido | 81,535 | 131,650 | 215,026 | 25 | Kaberamaido |
| Kaliro | 105,122 | 154,667 | 236,199 | 28 | Kaliro |
| Kamuli | 249,317 | 361,399 | 486,319 | 30 | Kamuli |
| Kapchorwa | 48,667 | 74,268 | 105,186 | 33 | Kapchorwa |
| Katakwi | 75,244 | 118,928 | 166,231 | 35 | Katakwi |
| Kibuku | 91,216 | 128,219 | 202,033 | 91 | Kibuku |
| Kumi | 102,030 | 165,365 | 239,268 | 45 | Kumi |
| Kween | 37,343 | 67,171 | 93,667 | 94 | Binyiny |
| Luuka | 130,408 | 185,526 | 238,020 | 98 | Luuka |
| Manafwa | 178,528 | 262,566 | 353,825 | 101 | Manafwa |
| Mayuge | 216,849 | 324,674 | 473,239 | 53 | Mayuge |
| Mbale | 240,929 | 332,571 | 488,960 | 54 | Mbale |
| Namayingo | 68,038 | 145,451 | 215,442 | 103 | Namayingo |
| Namutumba | 123,871 | 167,691 | 252,562 | 14 | Namutumba |
| Ngora | 59,392 | 101,867 | 141,919 | 105 | Ngora |
| Pallisa | 166,092 | 255,870 | 386,890 | 69 | Pallisa |
| Serere | 90,386 | 176,479 | 285,903 | 110 | Serere |
| Sironko | 147,729 | 97,273 | 242,422 | 73 | Sironko |
| Soroti | 113,872 | 193,310 | 296,833 | 74 | Soroti |
| Tororo | 285,299 | 379,399 | 517,082 | 75 | Tororo |
| Total[1][2] | 4,128,469 | 6,204,915 | 9,042,422 | - | Mbale |
External links
References
- 1 2 3 "Uganda: Administrative units (source: Uganda Bureau of Statistics)". GeoHive. Retrieved 18 June 2013.
- 1 2 3 4 "Uganda: Administrative Division". citypopulation.de. Retrieved 8 November 2016.
- ↑ "Sub-national HDI - Area Database - Global Data Lab". hdi.globaldatalab.org. Retrieved 2018-09-13.
This article is issued from Wikipedia. The text is licensed under Creative Commons - Attribution - Sharealike. Additional terms may apply for the media files.