| |||||||||||||||||||||||||||||||
39 (of 529) seats in the Lok Sabha | |||||||||||||||||||||||||||||||
|---|---|---|---|---|---|---|---|---|---|---|---|---|---|---|---|---|---|---|---|---|---|---|---|---|---|---|---|---|---|---|---|
| Registered | 40,027,212 | ||||||||||||||||||||||||||||||
| Turnout | 26,763,788 (66.86%) | ||||||||||||||||||||||||||||||
| |||||||||||||||||||||||||||||||
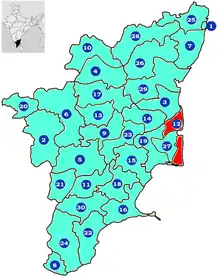
 1989 election map (by constituencies) Green = INC+ (won all the seats) | |||||||||||||||||||||||||||||||
The 1989 Indian general election polls in Tamil Nadu were held for 39 seats in the state. The result was a landslide victory for Indian National Congress, and its ally All India Anna Dravida Munnetra Kazhagam, winning 38 out of 39 seats. This election marked the dominance of INC-AIADMK in Tamil Nadu, till 1996. The opposition party Dravida Munnetra Kazhagam failed to win a single seat, resulting in the party's downturn in national and state politics for the coming years. Because National Front won at the national level, Rajya Sabha member Murasoli Maran got a cabinet berth in the new V. P. Singh administration.
Voting and results

| Alliance | Party | Popular Vote | Percentage | Swing | Seats won | Seat Change | ||
|---|---|---|---|---|---|---|---|---|
| AIADMK+ | Indian National Congress | 10,524,027 | 39.86% | 27 | ||||
| All India Anna Dravida Munnetra Kazhagam | 4,518,649 | 17.12% | 11 | |||||
| Total | 15,042,676 | 56.98% | 38 | |||||
| National Front | Communist Party of India | 539,316 | 2.04% | 1 | ||||
| Dravida Munnetra Kazhagam | 7,038,849 | 26.66% | 0 | |||||
| Communist Party of India (Marxist) | 965,838 | 3.66% | 0 | |||||
| Janata Dal | 374,902 | 1.42% | new party | 0 | new party | |||
| Total | 8,918,905 | 33.78% | 1 | |||||
| Pattali Makkal Katchi | 1,536,350 | 5.82% | new party | 0 | new party | |||
| Independents | 599,759 | 2.27% | 0 | |||||
| Other Parties (14 parties) | 302,040 | 1.15% | 0 | |||||
| Total | 26,399,730 | 100.00% | 39 | |||||
| Valid Votes | 26,399,730 | 98.64% | ||||||
| Invalid Votes | 364,058 | 1.36% | ||||||
| Total Votes | 26,763,788 | 100.00% | ||||||
| Reigstered Voters/Turnout | 40,027,212 | 66.86% | ||||||
- The two seats won in 1984 represents seats won by DMK.
List of Elected MPs
Post-election Union Council of Ministers from Tamil Nadu
Source: New York Times[1]
Due to the fact, that the DMK-JD were routed in Tamil Nadu, VP Singh had to choose Rajya Sabha member, Murasoli Maran to represent Tamil Nadu in his cabinet.
Cabinet Ministers
| Minister | Party | Lok Sabha Constituency/Rajya Sabha | Portfolios |
|---|---|---|---|
| Murasoli Maran | DMK | Rajya Sabha | Minister of Urban Development |
See also
Bibliography
References
- ↑ Crossette, Barbara (6 December 1989). "New Indian Leader Swears in Cabinet". The New York Times.