The following is a list of major snow and ice events in the United States that have caused noteworthy damage and destruction in their wake. The categories presented below are not used to measure the strength of a storm, but are rather indicators of how severely the snowfall affected the population in the storm's path. Some information such as snowfall amounts or lowest pressure may be unavailable due to a lack of documentation. Winter storms can produce both ice and snow, but are usually more notable in one of these two categories. The "Maximum accumulation" sections reflect the more notable category which is represented in inches of snow unless otherwise stated. Only category 1 and higher storms as defined by their regional snowfall index are included here.
- Note: A blizzard is defined as having sustained winds of at least 35 mph for three hours or more.
| Category | RSI value | Description | |||
| Five | 18.0+ | Extreme | |||
| Four | 10–18 | Crippling | |||
| Three | 6–10 | Major | |||
| Two | 3–6 | Significant | |||
| One | 1–3 | Notable | |||
| Zero | <1.0 | Nuisance | |||
Seasonal summaries
The following is a table that shows North American winter season summaries dating back to 2009. While there is no well-agreed-upon date used to indicate the start of winter in the Northern Hemisphere, there are two definitions of winter which may be used. The first is astronomical winter, which has the season starting on a date known as the winter solstice, often on or around December 21. The season lasts until the spring equinox, which often occurs on or around March 20. The second has to do with meteorological winter which varies with latitude for a start date.[1] Winter is often defined by meteorologists to be the three calendar months with the lowest average temperatures. Since both definitions span the start of the calendar year, it is possible to have a winter storm occur two different years.
| Winter Season | Maximum accumulation | Number of RSI events |
|---|---|---|
| 2009–2010 | 53 inches (130 cm) (February 25–27, 2010) |
7 |
| 2010–2011 | 50 inches (130 cm) (January 16–20, 2012) |
10 |
| 2011–2012 | 53 inches (130 cm) (February 25–27, 2010) |
3 |
| 2012–2013 | 40 inches (100 cm) (February 7–18, 2013) |
9 |
| 2013–2014 | 58 inches (150 cm) (October 3–7, 2013) |
10 |
| 2014–2015 | 88 inches (220 cm) (November 13–21, 2014) |
9 |
| 2015–2016 | 51.3 inches (130 cm) (April 15–23, 2016) |
4 |
| 2016–2017 | 58 inches (150 cm) (March 11–15, 2017) |
4 |
| 2017–2018 | 39.3 inches (100 cm) (March 1–3, 2018) |
7 |
| 2018–2019 | 52 inches (130 cm) (March 8–16, 2019) |
8 |
| 2019–2020 | 114 inches (290 cm) (Mid-March blizzard) |
1 |
| 2020–2021 | 107 inches (270 cm) (January 25–February 3, 2021) |
6 |
| 2021–2022 | 60 inches (150 cm) (December 13–18, 2021) |
4 |
| 2022–2023 | 81.2 inches (206 cm) (November 16–20, 2022) |
3 |
18th–19th century
| Year | Date | Maximum accumulation | Lowest pressure | Type |
|---|---|---|---|---|
| 1717[lower-alpha 1] | February 27 – March 7 | — | — | Storm |
| 1804 | October 4–11 | 48 inches (120 cm) | 977 hPa (28.9 inHg)[lower-alpha 2] | Blizzard |
| 1886 | January 6–11 | 18.5 inches (47 cm) | — | Blizzard |
| 1888 | January 12–13 | 6 inches (15 cm) | — | |
| March 11–14 | 58 inches (150 cm) | 982 hPa (29.0 inHg) | ||
| 1899 | February 10–14[2] | — | — |
20th century
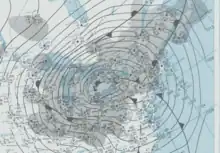
| Year | Date | Maximum accumulation | Lowest pressure | Type | Category (RSI) |
|---|---|---|---|---|---|
| 1905 | November 27–28[3] | — | 991 hPa (29.3 inHg) | Storm | — |
| 1913 | November 6–11 | 24 inches (61 cm) | 968.5 hPa (28.60 inHg) | Blizzard | — |
| 1920 | March 15–18 | — | — | Blizzard | — |
| 1922 | January 27–29 | — | — | Blizzard | Category 5 |
| 1940 | November 10–12 | 27 inches (69 cm) | 971 hPa (28.7 inHg) | Blizzard | — |
| 1944 | December 10-13 | 36 inches (91 cm) | — | Storm | Category 3 |
| 1947 | December 25–26 | 26.4 inches (67 cm) | — | Blizzard | Category 3 |
| 1950 | November 24–30 | 57 inches (140 cm) | 978 hPa (28.9 inHg) | Blizzard | Category 5 |
| 1952 | February 17–18 | — | — | Storm | — |
| 1956 | March 18–19 | — | — | Blizzard | — |
| 1958 | March 18–21 | — | — | Storm | Category 3 |
| 1960 | December 11–12 | 21.4 inches (54 cm) | 966 hPa (28.5 inHg) | Blizzard | Category 2 |
| 1961 | January 1–3 | 8 inches (20 cm)[lower-alpha 3] | — | Ice storm | — |
| 1963 | October 25–30 | 48 inches (120 cm) | 948 hPa (28.0 inHg)[lower-alpha 4] | Storm | — |
| 1966 | January 27–31 | 103 inches (260 cm) | — | Blizzard | Category 4 |
| 1967 | January 26–27 | 23 inches (58 cm) | 997 hPa (29.4 inHg) | Blizzard | Category 5 |
| 1969 | February 8–10 | — | 970 hPa (29 inHg) | Blizzard | Category 2 |
| March 5–8 | — | — | Storm | — | |
| December 25–28 | — | 976 hPa (28.8 inHg) | Storm | — | |
| 1971 | March 3–5 | — | — | Blizzard | — |
| 1973 | December 16–17 | 1 inch (2.5 cm)[lower-alpha 3] | 992 hPa (29.3 inHg) | Ice storm | — |
| 1975 | January 9–12 | 27 inches (69 cm) | 961 hPa (28.4 inHg) | Blizzard | Category 3 |
| 1976 | February 2 | 56 inches (140 cm) | 957 hPa (28.3 inHg) | Blizzard | — |
| 1977 | January 28 – February 1 | 100 inches (250 cm) | — | Blizzard | — |
| 1978 | January 25–27 | 36 inches (91 cm) | 955.5 hPa (28.22 inHg) | Blizzard | Category 5 |
| February 5–7 | 40 inches (100 cm) | — | Blizzard | Category 5 | |
| 1979 | January 13–14 | 21 inches (53 cm) | — | Blizzard | Category 4 |
| 1991 | October 31 – November 3 | 37 inches (94 cm) | 984 hPa (29.1 inHg) | Blizzard | Category 5 |
| 1992 | December 10–12 | 48 inches (120 cm) | 985 hPa (29.1 inHg) | Blizzard | Category 2 |
| 1993 | March 12–15 | 69 inches (180 cm) | 960 hPa (28 inHg) | Blizzard | Category 5 |
| 1995 | February 2–6 | 20 inches (51 cm) | 962 hPa (28.4 inHg) | Storm | Category 2 |
| 1996 | January 6–10 | 48 inches (120 cm) | 980 hPa (29 inHg) | Blizzard | Category 5 |
| 1997 | March 31 – April 1 | — | 979 hPa (28.9 inHg) | Blizzard | Category 2 |
| October 24–26 | — | — | Storm | — | |
| 1998 | January 4–10 | 5 inches (13 cm)[lower-alpha 3] | — | Ice storm | — |
| 1999 | January 2–4 | 21.6 inches (55 cm) | — | Storm | Category 4 |
| January 14–15 | — | — | Ice storm | — | |
21st century
.jpg.webp)
2000s
| Year | Date | Maximum accumulation | Lowest pressure | Type | Category (RSI) |
|---|---|---|---|---|---|
| 2000 | January 18–30 | 30 inches (76 cm) | — | Blizzard | Category 3 |
| December 27–31 | 30 inches (76 cm) | — | Storm | Category 2 | |
| 2002 | January 29–31 | 3 inches (7.6 cm)[lower-alpha 3] | — | Ice storm | Category 2 |
| February 7 | — | 994 hPa (29.4 inHg) | Storm | — | |
| December 4–5 | — | — | Ice storm | — | |
| 2003 | February 14–19 | 44 inches (110 cm) | 999 hPa (29.5 inHg) | Blizzard | Category 4 |
| December 5–8 | 35.6 inches (90 cm) | 992 hPa (29.3 inHg) | Blizzard | Category 3 | |
| 2004 | December 21–24 | 39 inches (99 cm) | 984 hPa (29.1 inHg) | Storm | Category 4 |
| December 24–28 | 18 inches (46 cm)[lower-alpha 5] | 964 hPa (28.5 inHg) | Storm | — | |
| 2005 | January 20–23 | 40.5 inches (103 cm) | — | Blizzard | Category 4 |
| December 14–16 | 0.75 inches (1.9 cm)[lower-alpha 3] | — | Ice storm | — | |
| 2006 | February 11–13 | 30.2 inches (77 cm) | 971 hPa (28.7 inHg) | Blizzard | Category 2 |
| October 11–13 | 24 inches (61 cm) | 980 hPa (29 inHg) | Storm | — | |
| November 20–24 | 5 inches (13 cm)[lower-alpha 6] | 944 hPa (27.9 inHg) | Storm | — | |
| November 26 – December 1 | — | — | Storm | — | |
| December 20–31 | 32 inches (81 cm)[lower-alpha 1] | — | Blizzard | — | |
| 2007 | January 11–24 | 4 inches (10 cm)[lower-alpha 3] | 961 hPa (28.4 inHg) | Ice storm | Category 2 |
| February 12–20 | 48 inches (120 cm) | 970 hPa (29 inHg) | Blizzard | Category 3 | |
| April 13–17 | 23 inches (58 cm) | 969 hPa (28.6 inHg) | Storm | Category 1 | |
| November 29 – December 4 | 14 inches (36 cm)[lower-alpha 1] | 952 hPa (28.1 inHg) | Storm | — | |
| November 29 – December 5 | 44 inches (110 cm) | 976 hPa (28.8 inHg) | Storm | — | |
| December 8–18 | 24 inches (61 cm)[lower-alpha 1] | 974 hPa (28.8 inHg) | Various | — | |
| 2008 | January 3–11 | — | 956 hPa (28.2 inHg) | Blizzard | — |
| March 6–10 | 28.5 inches (72 cm) | 984 hPa (29.1 inHg) | Blizzard | — | |
| December 11–12 | — | — | Ice storm | — | |
| December 19–25 | — | — | Storm | — | |
| 2009 | January 25–30 | 2.5 inches (6.4 cm)[lower-alpha 3] | 999 hPa (29.5 inHg) | Ice storm | — |
| October 13–20 | 23 inches (58 cm) | 966 hPa (28.5 inHg) | Blizzard | — | |
| December 16–20 | 26.3 inches (67 cm) | 968 hPa (28.6 inHg) | Blizzard | Category 4 | |
| December 22–28 | 40 inches (100 cm) | 985 hPa (29.1 inHg) | Blizzard | Category 5 |
2010s
| Year | Date | Maximum accumulation | Lowest pressure | Type | Category (RSI) |
|---|---|---|---|---|---|
| 2010 | February 5–6 | 38.3 inches (97 cm) | 978 hPa (28.9 inHg) | Blizzard | Category 4 |
| February 9–10 | 27.5 inches (70 cm) | 969 hPa (28.6 inHg) | Blizzard | Category 2 | |
| February 25–27 | 53 inches (130 cm) | 972 hPa (28.7 inHg) | Blizzard | Category 4 | |
| March 12–16 | — | 993 hPa (29.3 inHg) | Storm | — | |
| October 23–28 | 9 inches (23 cm) | 955.2 hPa (28.21 inHg) | Blizzard | — | |
| December 5–29 | 36 inches (91 cm) | 960 hPa (28 inHg) | Blizzard | Category 2 | |
| 2011 | January 8–13 | 40.5 inches (103 cm) | — | Blizzard | Category 2 |
| January 25–27 | — | — | Blizzard | Category 1 | |
| January 31 – February 2 | 27 inches (69 cm) | 996 hPa (29.4 inHg) | Blizzard | Category 5 | |
| October 28 – November 1 | 32 inches (81 cm) | 971 hPa (28.7 inHg) | Blizzard | Category 1 | |
| November 8–10 | 6.4 inches (16 cm) | 943 hPa (27.8 inHg) | Blizzard | — | |
| 2012 | January 16–20 | 50 inches (130 cm) | 992 hPa (29.3 inHg) | Blizzard | — |
| October 29 – November 2 | 36 inches (91 cm) | 940 hPa (28 inHg)[lower-alpha 7] | Storm | — | |
| November 7–10 | 13.5 inches (34 cm) | 984 hPa (29.1 inHg) | Storm | Category 1 | |
| December 17–22 | 15.2 inches (39 cm) | 971 hPa (28.7 inHg) | Blizzard | Category 2 | |
| December 25–28 | 27 inches (69 cm) | 968 hPa (28.6 inHg) | Blizzard | Category 1 | |
| 2013 | February 7–18 | 40 inches (100 cm) | 968 hPa (28.6 inHg) | Blizzard | Category 3 |
| March 1–10 | 36 inches (91 cm) | 986 hPa (29.1 inHg) | Blizzard | Category 2 | |
| October 3–5 | 58 inches (150 cm) | 999 hPa (29.5 inHg) | Blizzard | Category 3 | |
| November 22-27 | 48 inches (120 cm) | N/A | Storm | — | |
| December 19–23 | 14 inches (36 cm) | 997 hPa (29.4 inHg) | Storm | — | |
| 2014 | December 30 – January 6 | 23.8 inches (60 cm) | 936 hPa (27.6 inHg) | Storm | Category 2 |
| January 19–24 | 18.3 inches (46 cm) | 962 hPa (28.4 inHg) | Blizzard | Category 1 | |
| January 27–31 | 10 inches (25 cm) | 999 hPa (29.5 inHg) | Blizzard | Category 1 | |
| February 11–24 | 27.5 inches (70 cm) | 968 hPa (28.6 inHg) | Blizzard | Category 4 | |
| November 7–13 | — | — | Blizzard | — | |
| November 13–21 | 88 inches (220 cm) | 961 hPa (28.4 inHg) | Storm | — | |
| 2015 | January 23–30 | 36 inches (91 cm) | 970 hPa (29 inHg) | Blizzard | Category 3 |
| January 31 – February 2 | 24.1 inches (61 cm) | 978 hPa (28.9 inHg) | Blizzard | Category 3 | |
| February 12–17 | 27.4 inches (70 cm) | 958 hPa (28.3 inHg) | Blizzard | Category 1 | |
| March 1–6 | 54.6 inches (139 cm) | 993 hPa (29.3 inHg) | Blizzard | — | |
| November 24–27 | 1.5 inches (3.8 cm)[lower-alpha 3] | 994 hPa (29.4 inHg) | Ice storm | — | |
| December 26–30 | 41 inches (100 cm) | 989 hPa (29.2 inHg) | Blizzard | — | |
| 2016 | January 21–24 | 42 inches (110 cm) | 983 hPa (29.0 inHg) | Blizzard | Category 5 |
| January 29 – February 7 | 41 inches (100 cm) | — | Blizzard | Category 2 | |
| February 7–10 | 11 inches (28 cm) | 976 hPa (28.8 inHg) | Blizzard | — | |
| February 23–24 | 17 inches (43 cm) | — | Storm | — | |
| March 21–25 | 32.5 inches (83 cm) | 989 hPa (29.2 inHg) | Blizzard | — | |
| April 15–23 | 51.3 inches (130 cm) | 999 hPa (29.5 inHg) | Blizzard | — | |
| 2017 | January 4–8 | 56 inches (140 cm) | 987 hPa (29.1 inHg) | Blizzard | Category 2 |
| January 7–13, 19–24 February 8–22 |
— | — | Storm | — | |
| January 10–17 | 1 inch (2.5 cm)[lower-alpha 3] | 999 hPa (29.5 inHg) | Ice storm | — | |
| February 6–10 | 24 inches (61 cm) | 969 hPa (28.6 inHg) | Blizzard | Category 1 | |
| February 12–15 | 40 inches (100 cm) | 968 hPa (28.6 inHg) | Blizzard | — | |
| March 11–15 | 58 inches (150 cm) | 974 hPa (28.8 inHg) | Blizzard | Category 4 | |
| October 29-31 | 8.4 inches (21 cm) | 975 hPa (28.8 inHg) | Storm | — | |
| December 8-10 | 25 inches (64 cm) | — | Storm | Category 2 | |
| 2018 | January 2–4 | 22 inches (56 cm) | 949 hPa (28.0 inHg) | Blizzard | Category 1 |
| March 1–3 | 39.3 inches (100 cm) | 974 hPa (28.8 inHg) | Blizzard | Category 1 | |
| March 6–8 | 36 inches (91 cm) | 986 hPa (29.1 inHg) | Blizzard | Category 1 | |
| March 20–22 | 20.1 inches (51 cm) | 988 hPa (29.2 inHg) | Storm | Category 2 | |
| April 13–15 | 33 inches (84 cm) | 985 hPa (29.1 inHg) | Storm | Category 4 | |
| 2019 | January 16–21 | 52 inches (130 cm) | — | Storm | Category 1 |
| February 11–13 | 26.5 inches (67 cm) | — | Blizzard | — | |
| March 8–16 | 52 inches (130 cm) | 968 hPa (28.6 inHg) | Blizzard | Category 1 | |
| April 10–14 | 30 inches (76 cm) | 982 hPa (29.0 inHg) | Blizzard | Category 3 | |
| November 26 – December 3 | — | 973 hPa (28.7 inHg) | Blizzard | Category 2 |
2020s
| Year | Date | Maximum accumulation | Lowest pressure | Type | Category (RSI) |
|---|---|---|---|---|---|
| 2020 | January 15–18 | 37 inches (94 cm) | 979 hPa (28.9 inHg) | Blizzard | — |
| February 2–5 | 23.5 inches (60 cm) | 943 hPa (27.8 inHg)[lower-alpha 8] | Storm | — | |
| February 9–13 | 13 inches (33 cm) | 920 hPa (27 inHg)[lower-alpha 9] | Blizzard | — | |
| October 29–30 | 6.5 inches (17 cm) | 970 hPa (29 inHg)[lower-alpha 10] | Storm | — | |
| November 29–December 2 | 24 inches (61 cm) | 989 hPa (29.2 inHg) | Storm | — | |
| December 4–6 | 18 inches (46 cm) | 976 hPa (28.8 inHg) | Blizzard | — | |
| December 14–18 | 44 inches (110 cm) | 995 hPa (29.4 inHg) | Storm | Category 2 | |
| December 30–January 2, 2021 | 24 inches (61 cm) | 1,001 hPa (29.6 inHg) | Storm | Category 1 | |
| 2021 | January 25–February 3 | 36.1 inches (92 cm) | 984 hPa (29.1 inHg) | Blizzard | Category 3 |
| February 6–8 | 14 inches (36 cm) | 960 hPa (28 inHg) | Storm | — | |
| February 13–17 | 26 inches (66 cm) | 960 hPa (28 inHg) | Blizzard | Category 3 | |
| February 15–20 | 24 inches (61 cm) | 948 hPa (28.0 inHg) | Storm | Category 3 | |
| March 10–16 | 52.5 inches (133 cm) | 980 hPa (29 inHg) | Blizzard | Category 3 | |
| March 16–17 | 6.2 inches (16 cm) | 997 hPa (29.4 inHg) | Blizzard | — | |
| April 15–17 | 14 inches (36 cm) | 988 hPa (29.2 inHg) | Storm | — | |
| 2022 | January 3-4 | 15.5 inches (39 cm) | 980 hPa (29 inHg) | Storm | — |
| January 14–17 | 27.5 inches (70 cm) | 981 hPa (29.0 inHg) | Storm | Category 2 | |
| January 28–30 | 30.4 inches (77 cm) | 969 hPa (28.6 inHg) | Blizzard | Category 1 | |
| February 1–5 | 37 inches (94 cm) | 1,004 hPa (29.6 inHg) | Storm | Category 2 | |
| February 22-26 | 12.2 inches (31 cm) | N/A | Storm | — | |
| April 11-13 | 47 inches (120 cm) | 983 hPa (29.0 inHg) | Storm | — | |
| November 16–20 | 81.6 inches (207 cm) | Storm | — | ||
| December 21–26 | 56.5 inches (144 cm) | 963 hPa (28.4 inHg) | Blizzard | Category 4 | |
| 2023 | January 31 - February 2 | N/A | 1,016 hPa (30.0 inHg) | Storm | — |
| February 21-28 | N/A | N/A | Blizzard | Category 2 | |
| March 9-15 | 42.1 inches (107 cm) | N/A | Storm | Category 2 |
See also
Notes
- 1 2 3 4 This event included multiple different storms.
- ↑ The 1804 New England hurricane caused a major snow event.
- 1 2 3 4 5 6 7 8 9 Freezing rain
- ↑ Hurricane Ginny caused a major snow event.
- ↑ This storm was significant for its snow impact on Texas.
- ↑ While this nor'easter was not a major snow event, it was notable for the earliest snowfall ever recorded in Charleston, South Carolina and Savannah, Georgia.
- ↑ Hurricane Sandy caused a major snow event.
- ↑ Storm Ciara caused a major snow event.
- ↑ Storm Dennis caused a major snow event.
- ↑ Hurricane Zeta caused a moderate snow event.
References
- ↑ "Winter's Been Here Despite What the Calendar Says". NOAA Magazine. 22 December 2003. Archived from the original on 16 July 2011. Retrieved 22 December 2011.
- ↑ Griffin, Melissa (February 11, 2015). "The Great Blizzard of 1899". WeatherSTEM.
- ↑ C.P. Labadie. "Famous for all the wrong reasons". Duluth Seaway Port Authority. Archived from the original on June 8, 2010. Retrieved December 8, 2017.