| ||||||||||||||||||||||||||||||||||
All 100 seats in the Virginia House of Delegates 51 seats needed for a majority | ||||||||||||||||||||||||||||||||||
|---|---|---|---|---|---|---|---|---|---|---|---|---|---|---|---|---|---|---|---|---|---|---|---|---|---|---|---|---|---|---|---|---|---|---|
| Turnout | 30.2%[1] | |||||||||||||||||||||||||||||||||
| ||||||||||||||||||||||||||||||||||
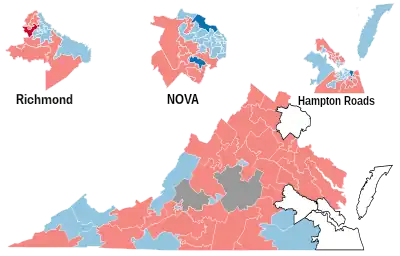 Results: Republican hold Republican gain Democratic hold Democratic gain Independent hold | ||||||||||||||||||||||||||||||||||
| ||||||||||||||||||||||||||||||||||
.png.webp)

| Elections in Virginia |
|---|
 |
The Virginia House of Delegates election of 2007 was held on Tuesday, November 6.
Results
Overview
| 54 | 44 | 2 |
| Republican | Democratic |
| Parties | Candidates | Seats | Popular Vote | ||||||
|---|---|---|---|---|---|---|---|---|---|
| 2005 | 2007 | +/- | Strength | Vote | % | Change | |||
| Republican | 57 | 54 | 59.00% | 620,724 | 50.98% | ||||
| Democratic | 40 | 44 | 45.00% | 522,604 | 42.92% | ||||
| Independent | 3 | 2 | 2.00% | 53,157 | 4.37% | ||||
| Independent Greens | 0 | 0 | 0.00% | 4,376 | 0.36% | ||||
| - | Write-ins | 0 | 0 | 0.00% | 16,812 | 1.38% | |||
| Total | 100 | 100 | 0 | 100.00% | 1,217,673 | 100.00% | - | ||
By House of Delegates district
Party abbreviations: D - Democratic, R - Republican, I - Independent, IG - Independent Green, L - Libertarian
Note: Only House districts that were contested by more than one candidate are included here.
| District | Incumbent | Party | Elected | Status | 2007 Result |
|---|---|---|---|---|---|
| 1st | Terry Kilgore | Republican | 1993 | Reelected | Terry Kilgore (R) 72.3% Jerry Taylor (D) 27.6% |
| 5th | Bill Carrico | Republican | 2001 | Reelected | Bill Carrico (R) 55.4% Susie Dixon Garner (D) 44.5% |
| 6th | Anne Crockett-Stark | Republican | 2005 | Reelected | Anne Crockett-Stark (R) 55.6% Bill Thomas Jr. (D) 44.3% |
| 7th | Dave Nutter | Republican | 2001 | Reelected | Dave Nutter (R) 52.7% Peggy Frank (D) 47.3% |
| 9th | Allen Dudley | Republican | 1993 | Retired | Charles Poindexter (R) 46.4% Eric Ferguson (D) 43.9% Jerry Boothe (I) 9.6% |
| 11th | Onzlee Ware | Democratic | 2003 | Reelected | Onzlee Ware (D) 62.1% Mac McCadden (I) 37.3% |
| 13th | Bob Marshall | Republican | 1991 | Reelected | Bob Marshall (R) 58.3% Bruce Roemmelt (D) 41.6% |
| 14th | Danny Marshall III | Republican | 2001 | Reelected | Danny Marshall III (R) 51.9% Adam Tomer (D) 48.0% |
| 16th | Robert Hurt | Republican | 2001 | Elected to State Senate | Donald Merricks (R) 64.0% Andy Parker (D) 35.9% |
| 17th | William Fralin | Republican | 2003 | Reelected | William Fralin (R) 75.1% Alexander Ballin (I) 24.7% |
| 19th | Lacey Putney | Independent | 1961 | Reelected | Lacey Putney (I) 72.6% Lewis Medlin Jr. (D) 27.2% |
| 21st | John Welch | Republican | 2001 | Defeated | Bobby Mathieson (D) 57.5% John Welch (R) 42.1% |
| 26th | Matt Lohr | Republican | 2005 | Reelected | Matt Lohr (R) 71.1% Carolyn Frank (I) 28.5% |
| 28th | Bill Howell | Republican | 1987 | Reelected | William Howell (R) 61.7% Clyde Matthews (D) 34.8% Craig Ennis (IG) 3.2% |
| 31st | Scott Lingamfelter | Republican | 2001 | Reelected | Scott Lingamfelter (R) 55.3% Bill Day (D) 44.5% |
| 32nd | David Poisson | Democratic | 2005 | Reelected | David Poisson (D) 52.8% Lynn Chapman (R) 47.1% |
| 33rd | Joe May | Republican | 1993 | Reelected | Joe May (R) 59.8% Marty Martinez (D) 40.0% |
| 34th | Vince Callahan | Republican | 1967 | Retired | Margi Vanderhye (D) 51.5% Dave Hunt (R) 48.4% |
| 35th | Steve Shannon | Democratic | 2003 | Reelected | Steve Shannon (D) 63.4% Arthur Purves (R) 36.6% |
| 39th | Vivian Watts | Democratic | 1995 | Reelected | Vivian Watts (D) 78.3% Laura C. Clifton (IG) 21.2% |
| 40th | Tim Hugo | Republican | 2003 | Reelected | Tim Hugo (R) 57.1% Rex Simmons (D) 42.8% |
| 45th | David Englin | Democratic | 2005 | Reelected | David Englin (D) 64.2% Mark Allen (R) 35.7% |
| 49th | Adam Ebbin | Democratic | 2003 | Reelected | Adam Ebbin (D) 79.7% James Ronald Fisher (IG) 19.1% |
| 50th | Jackson Miller | Republican | 2006 | Reelected | Jackson Miller (R) 60.4% Jeanette Rishell (D) 39.5% |
| 51st | Michele McQuigg | Republican | 1997 | Elected to Clerk of Court | Paul Nichols (D) 51.8% Faisal Gill (R) 47.7% |
| 52nd | Jeff Frederick | Republican | 2003 | Reelected | Jeff Frederick (R) 58.6% Christopher Brown (D) 41.2% |
| 54th | Bobby Orrock | Republican | 1989 | Reelected | Bobby Orrock (R) 73.7% Kimbra Kincheloe (I) 26.2% |
| 56th | Bill Janis | Republican | 2001 | Reelected | Bill Janis (R) 65.9% Will Shaw (D) 34.0% |
| 59th | Watkins Abbitt | Independent | 1985 | Reelected | Watkins Abbitt (I) 60.2% Connie Brennan (D) 39.7% |
| 67th | Chuck Caputo | Democratic | 2005 | Reelected | Chuck Caputo (D) 52.7% Marc Cadin (R) 47.3% |
| 68th | Katherine Waddell | Independent | 2005 | Defeated | Manoli Loupassi (R) 54.1% Katherine Waddell (I) 42.1% Bill Grogan (I) 3.7% |
| 69th | Frank Hall | Democratic | 1975 | Reelected | Frank Hall (D) 82.8% Ray Gargiulo (R) 17.0% |
| 72nd | Jack Reid | Republican | 1989 | Retired | Jimmie Massie (R) 67.2% Tom Herbert (D) 32.7% |
| 78th | John Cosgrove | Republican | 2001 | Reelected | John Cosgrove (R) 61.7% Mick Meyer (D) 38.2% |
| 82nd | Bob Purkey | Republican | 1985 | Reelected | Bob Purkey (R) 60.6% Bob MacIver (D) 39.2% |
| 83rd | Leo Wardrup | Republican | 1991 | Retired | Joe Bouchard (D) 50.6% Chris Stolle (R) 49.2% |
| 86th | Tom Rust | Republican | 2001 | Reelected | Tom Rust (R) 52.8% Jay Donahue (D) 47.1% |
| 87th | Paula Miller | Democratic | 2005 | Reelected | Paula Miller (D) 54.0% Hank Giffin (R) 45.8% |
| 88th | Mark Cole | Republican | 2001 | Reelected | Mark Cole (R) 62.2% Carlos Del Toro (D) 37.6% |
| 94th | Glenn Oder | Republican | 2001 | Reelected | Glenn Oder (R) 74.3% William D. Pelkey (I) 25.1% |
| 96th | Melanie Rapp | Republican | 2001 | Retired | Brenda Pogge (R) 56.8% Troy Farlow (D) 36.6% Pam Pouchot (I) 6.1% |
See also
- 2007 United States elections
- 2007 Virginia elections
- 2007 Virginia Senate election
References
- ↑ "Registration/Turnout Statistics". Virginia Department of Elections. Archived from the original on October 18, 2018. Retrieved February 14, 2018.
- ↑ "Election Results - Virginia Department of Elections".
This article is issued from Wikipedia. The text is licensed under Creative Commons - Attribution - Sharealike. Additional terms may apply for the media files.