| |||||||||||||||||||||||||||||||
All 81 seats in the Philippine Assembly 41 seats needed for a majority | |||||||||||||||||||||||||||||||
|---|---|---|---|---|---|---|---|---|---|---|---|---|---|---|---|---|---|---|---|---|---|---|---|---|---|---|---|---|---|---|---|
| |||||||||||||||||||||||||||||||
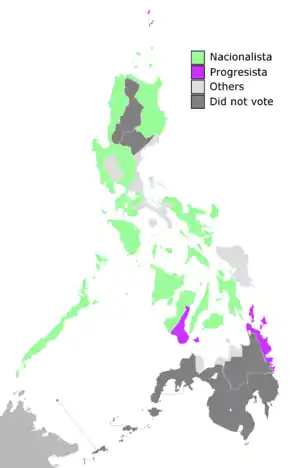 Parties that won a plurality of votes in each province. Results for local offices are also included as a separate tally for the Philippine Assembly was not provided. | |||||||||||||||||||||||||||||||
| |||||||||||||||||||||||||||||||
 |
|---|
|
|
Philippine Assembly and local elections were held in the Philippines on June 4, 1912.
Results
|
| Party | Votes | % | +/– | Seats | +/– | |
|---|---|---|---|---|---|---|
| Nacionalista Party | 124,753 | 53.35 | +5.16 | 62 | 0 | |
| Progresista Party | 37,842 | 16.18 | −3.82 | 16 | −1 | |
| Others | 8,437 | 3.61 | −20.90 | 0 | 0 | |
| Independent | 62,804 | 26.86 | +21.44 | 3 | +1 | |
| Total | 233,836 | 100.00 | – | 81 | 0 | |
| Registered voters/turnout | 248,154 | – | ||||
| Source: Philippine Commission. Report of the Philippine Commission to the Secretary of War 1912. & Cesar Pobre. Philippine Legislatures: 100 Years. | ||||||
See also
External links
| General elections | |
|---|---|
| Presidential elections | |
| Senate elections | |
| House elections | |
| Constitutional conventions | |
| Local elections | |
| Barangay elections | |
| Referendums | |
| |
This article is issued from Wikipedia. The text is licensed under Creative Commons - Attribution - Sharealike. Additional terms may apply for the media files.