| |||||||||||||||||||
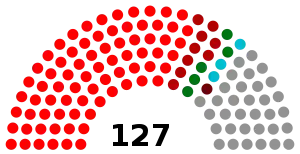
All 127 seats in the National Assembly 64 seats needed for a majority | |||||||||||||||||||
|---|---|---|---|---|---|---|---|---|---|---|---|---|---|---|---|---|---|---|---|
| |||||||||||||||||||


 |
|---|
|
|
Parliamentary elections were held in Madagascar on 4 September 1960. They were won by the Social Democratic Party, which claimed 76 of the 127 seats in the National Assembly. Voter turnout was 77.5%.[1]
Results
 | ||||
|---|---|---|---|---|
| Party | Votes | % | Seats | |
| Social Democratic Party | 1,156,684 | 61.6 | 76 | |
| Congress Party for the Independence of Madagascar | 220,640 | 10.7 | 9 | |
| National Rally of Madagascar | 5 | |||
| Malagasy Christian Rally | 3 | |||
| Malagasy Democratic and Social Union | 1 | |||
| Others | 33 | |||
| Total | 127 | |||
| Valid votes | 1,876,586 | 99.11 | ||
| Invalid/blank votes | 16,883 | 0.89 | ||
| Total votes | 1,893,469 | 100.00 | ||
| Registered voters/turnout | 2,444,269 | 77.47 | ||
| Source: Nohlen et al. | ||||
References
| Presidential elections | |
|---|---|
| Parliamentary elections | |
| Local elections |
|
| French elections |
|
| Referendums | |
This article is issued from Wikipedia. The text is licensed under Creative Commons - Attribution - Sharealike. Additional terms may apply for the media files.