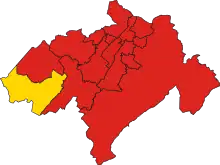
Results by ward.
Elections to Midlothian District Council were held in May 1980, the same day as the other Scottish local government elections.
Election results
| Party | Seats | Gains | Losses | Net gain/loss | Seats % | Votes % | Votes | +/− | |
|---|---|---|---|---|---|---|---|---|---|
| Labour | 13 | 52.0 | 10,985 | ||||||
| Liberal | 1 | 6.3 | 1,323 | ||||||
| Independent | 1 | 5.0 | 1,057 | ||||||
| Conservative | 0 | 18.1 | 3,830 | ||||||
| SNP | 0 | 16.1 | 3,409 | ||||||
| Communist | 0 | 0.7 | 153 | ||||||
| Other parties | 0 | 1.7 | 361 | ||||||
Ward results
References
| Metropolitan boroughs |
|
|---|---|
| District councils (England) |
|
| District councils (Scotland) |
|
This article is issued from Wikipedia. The text is licensed under Creative Commons - Attribution - Sharealike. Additional terms may apply for the media files.