| |||||||||||||||||||||||||||||||||||||||||||||||||||||||||||||||||||||||||||||||||||||||||
15 seats to the European Parliament | |||||||||||||||||||||||||||||||||||||||||||||||||||||||||||||||||||||||||||||||||||||||||
|---|---|---|---|---|---|---|---|---|---|---|---|---|---|---|---|---|---|---|---|---|---|---|---|---|---|---|---|---|---|---|---|---|---|---|---|---|---|---|---|---|---|---|---|---|---|---|---|---|---|---|---|---|---|---|---|---|---|---|---|---|---|---|---|---|---|---|---|---|---|---|---|---|---|---|---|---|---|---|---|---|---|---|---|---|---|---|---|---|---|
| Turnout | 50.2% | ||||||||||||||||||||||||||||||||||||||||||||||||||||||||||||||||||||||||||||||||||||||||
| |||||||||||||||||||||||||||||||||||||||||||||||||||||||||||||||||||||||||||||||||||||||||
| Members of the European Parliament for Ireland | |
|---|---|
| 1st delegation | (1973) |
| 2nd delegation | (1973–1977) |
| 3rd delegation | (1977–1979) |
| 1st term | (1979) |
| 2nd term | (1984) |
| 3rd term | (1989) |
| 4th term | (1994) |
| 5th term | (1999) |
| 6th term | (2004) |
| 7th term | (2009) |
| 8th term | (2014) |
| 9th term | (2019) |
| 10th term | (2024) |
| List of women MEPs | |
The 1999 European Parliament election in Ireland was the Irish component of the 1999 European Parliament election. The election was conducted under the single transferable vote.
Results
| Party | European party | Party Leader | 1st Pref Vote | % | ±% | Seats | ± | |
|---|---|---|---|---|---|---|---|---|
| Fianna Fáil | UEN | Bertie Ahern | 537,757 | 38.6 | +3.6 | 6 | −1 | |
| Fine Gael | EPP-ED | John Bruton | 342,171 | 24.6 | +0.3 | 4 | ±0 | |
| Green Party | Greens/EFA | none | 93,100 | 6.7 | −1.2 | 2 | ±0 | |
| Labour Party | PES | Ruairi Quinn | 121,542 | 8.7 | −2.3 | 1 | ±0 | |
| Sinn Féin | Gerry Adams | 88,165 | 6.3 | +3.3 | 0 | ±0 | ||
| Socialist Party | Joe Higgins | 10,619 | 0.8 | +0.8 | 0 | ±0 | ||
| Independent | 198,386 | 14.3 | +7.4 | 2 | +1 | |||
| Total | 1,391,740 | 100 | — | 15 | — | |||
MEPs elected
Voting details

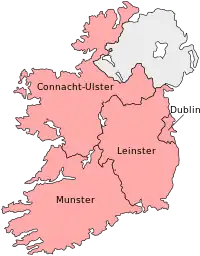
1979–2004 European Parliament Ireland constituencies
| Constituency | Electorate | Turnout | Spoilt | Valid Poll | Quota | Seats | Candidates |
|---|---|---|---|---|---|---|---|
| Connacht–Ulster | 541,552 | 332,236 (61.3%) | 12,085 (3.6%) | 320,151 | 80,038 | 3 | 11 |
| Dublin | 793,200 | 286,684 (36.1%) | 6,013 (2.1%) | 280,671 | 56,135 | 4 | 13 |
| Leinster | 706,200 | 357,064 (50.5%) | 14,725 (4.1%) | 342,339 | 68,468 | 4 | 8 |
| Munster | 823,008 | 462,303 (56.2%) | 13,724 (2.9%) | 448,579 | 89,716 | 4 | 10 |
| Total | 2,864,361 | 1,438,287 (50.2%) | 46,547 (3.2%) | 1,391,740 | — | 15 | 42 |
See also
- List of members of the European Parliament for Ireland, 1999–2004 – List ordered by constituency
External links
Footnotes
References
This article is issued from Wikipedia. The text is licensed under Creative Commons - Attribution - Sharealike. Additional terms may apply for the media files.
.jpg.webp)
.jpg.webp)
.jpg.webp)

.jpg.webp)