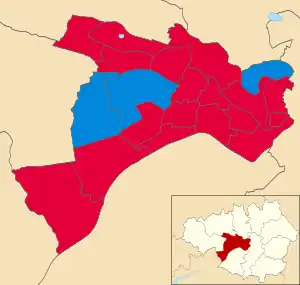
Map showing the results of the 2018 Salford City Council election
The 2018 Salford City Council election took place on 3 May 2018 to elect members of Salford City Council in England.[1]
This result had the following consequences for the total number of seats on the council before the elections:[2]
| Party | Previous council | New council | |||
|---|---|---|---|---|---|
| Labour | 49 | 50 | |||
| Conservative | 9 | 9 | |||
| Independent | 2 | 1 | |||
| Total | 60 | 60 | |||
| Working majority | 38 | 40 | |||
Ward results
Asterisk denotes the sitting councillor.[1]
Barton
| Party | Candidate | Votes | % | ±% | |
|---|---|---|---|---|---|
| Labour | David Jolley* | 1,348 | 64.2 | ||
| Conservative | Eileen MacDonald | 396 | 18.8 | ||
| UKIP | Janice Snelgrove | 170 | 8.1 | ||
| Green | Jennifer Mellish | 111 | 5.3 | ||
| Liberal Democrats | Rhona Brown | 76 | 3.6 | ||
| Majority | 952 | 45.3 | |||
| Turnout | 2,110 | 22.85 | |||
| Labour hold | Swing | ||||
Boothstown and Ellenbrook
| Party | Candidate | Votes | % | ±% | |
|---|---|---|---|---|---|
| Conservative | Jillian Collinson* | 1,456 | 56.4 | ||
| Labour | Phil Cusack | 906 | 35.1 | ||
| Liberal Democrats | Ian McKinlay | 87 | 3.4 | ||
| Green | Morvern Rennie | 75 | 2.9 | ||
| UKIP | Arthur Snelgrove | 57 | 2.2 | ||
| Majority | 551 | 21.3 | |||
| Turnout | 2,586 | 34.08 | |||
| Conservative hold | Swing | ||||
Broughton
| Party | Candidate | Votes | % | ±% | |
|---|---|---|---|---|---|
| Labour | John Merry* | 1,492 | 67.0 | ||
| Conservative | Gilliam MacKenzie | 369 | 16.6 | ||
| Green | David Jones | 141 | 6.3 | ||
| UKIP | Nicola Williamson | 135 | 6.1 | ||
| Liberal Democrats | Paul Dean | 90 | 4.0 | ||
| Majority | 1,123 | 50.4 | |||
| Turnout | 2,237 | 22.19 | |||
| Labour hold | Swing | ||||
Cadishead
| Party | Candidate | Votes | % | ±% | |
|---|---|---|---|---|---|
| Labour | Joan Walsh | 959 | 41.1 | ||
| Independent | Marcus Graham | 752 | 32.3 | ||
| Conservative | Catherine Bisbey | 461 | 19.8 | ||
| Green | Diane Cawood | 128 | 5.5 | ||
| Liberal Democrats | Benjamin Web | 31 | 1.3 | ||
| Majority | 207 | 8.9 | |||
| Turnout | 2,332 | 28.71 | |||
| Labour hold | Swing | ||||
Claremont
| Party | Candidate | Votes | % | ±% | |
|---|---|---|---|---|---|
| Labour | Neil Reynolds* | 1,167 | 49.2 | ||
| Conservative | Charlotte Woods | 473 | 19.9 | ||
| Liberal Democrats | Stef Lorenz | 406 | 17.1 | ||
| Independent | Mary Ferrer | 200 | 8.4 | ||
| Green | Daniel Towers | 117 | 4.9 | ||
| Majority | 694 | 29.4 | |||
| Turnout | 2,372 | 28.7 | |||
| Labour hold | Swing | ||||
Eccles
| Party | Candidate | Votes | % | ±% | |
|---|---|---|---|---|---|
| Labour | Michael Wheeler* | 1,748 | 60.3 | ||
| Conservative | David Hotchkin | 638 | 22.0 | ||
| Green | Helen Alker | 185 | 6.4 | ||
| Liberal Democrats | Guy Otten | 169 | 5.8 | ||
| UKIP | Keith Hallam | 134 | 4.6 | ||
| TUSC | Matt Kilsby | 23 | 0.8 | ||
| Majority | 1,110 | 38.3 | |||
| Turnout | 2,902 | 31.33 | |||
| Labour hold | Swing | ||||
Irlam
| Party | Candidate | Votes | % | ±% | |
|---|---|---|---|---|---|
| Labour Co-op | Roger Jones* | 936 | 44.4 | ||
| Independent | Darren Goulden | 769 | 36.4 | ||
| Conservative | James Mount | 357 | 16.9 | ||
| Liberal Democrats | James Blessing | 48 | 2.3 | ||
| Majority | 167 | 7.9 | |||
| Turnout | 2,116 | 30.28 | |||
| Labour Co-op hold | Swing | ||||
Irwell Riverside
| Party | Candidate | Votes | % | ±% | |
|---|---|---|---|---|---|
| Labour | Jane Hamilton* | 1,053 | 66.0 | ||
| Conservative | Max Dowling | 189 | 11.8 | ||
| Green | Wendy Olsen | 178 | 11.2 | ||
| UKIP | Jonathan Marsden | 97 | 6.1 | ||
| Liberal Democrats | Valerie Smith | 78 | 4.9 | ||
| Majority | 864 | 54.2 | |||
| Turnout | 1,601 | 19.98 | |||
| Labour hold | Swing | ||||
Kersal
| Party | Candidate | Votes | % | ±% | |
|---|---|---|---|---|---|
| Conservative | Ari Leitner | 1,660 | 59.0 | ||
| Labour | Anne-Marie Humphreys* | 910 | 32.4 | ||
| Green | Stuart Oxbrow | 94 | 3.3 | ||
| Liberal Democrats | Lucas Kane Webber | 78 | 2.8 | ||
| UKIP | John Roberts | 70 | 2.5 | ||
| Majority | 750 | 26.7 | |||
| Turnout | 2,821 | 35.21 | |||
| Conservative gain from Labour | Swing | ||||
Langworthy
| Party | Candidate | Votes | % | ±% | |
|---|---|---|---|---|---|
| Labour | John Warmisham* | 1,055 | 60.8 | ||
| Conservative | Craig Thompson | 202 | 11.6 | ||
| Liberal Democrats | Jake Overend | 183 | 10.6 | ||
| UKIP | Stacey Olsen | 147 | 8.5 | ||
| Green | Ian Pattinson | 147 | 8.5 | ||
| Majority | 853 | 49.2 | |||
| Turnout | 1,741 | 19.54 | |||
| Labour hold | Swing | ||||
Little Hulton
| Party | Candidate | Votes | % | ±% | |
|---|---|---|---|---|---|
| Labour | Collette Weir* | 1,186 | 67.4 | ||
| Conservative | Nathan James | 461 | 26.2 | ||
| Liberal Democrats | Lee Westley | 113 | 6.4 | ||
| Majority | 725 | 41.2 | |||
| Turnout | 1,771 | 19.88 | |||
| Labour hold | Swing | ||||
Ordsall
| Party | Candidate | Votes | % | ±% | |
|---|---|---|---|---|---|
| Labour | Tanya Burch* | 1,583 | 65.2 | ||
| Conservative | Joshua Nelson | 367 | 15.1 | ||
| Green | Emma Van Dyke | 263 | 10.8 | ||
| Liberal Democrats | John Grant | 215 | 8.9 | ||
| Majority | 1,216 | 50.1 | |||
| Turnout | 2,448 | 19.26 | |||
| Labour hold | Swing | ||||
Pendlebury
| Party | Candidate | Votes | % | ±% | |
|---|---|---|---|---|---|
| Labour | Sophia Linden | 1,262 | 58.2 | ||
| Conservative | Dorothy Chapman | 531 | 24.5 | ||
| Liberal Democrats | Beth Waller | 151 | 7.0 | ||
| UKIP | Seamus Martin | 147 | 6.8 | ||
| Green | Alastair Dewberry | 79 | 3.6 | ||
| Majority | 731 | 33.7 | |||
| Turnout | 2,175 | 24.05 | |||
| Labour hold | Swing | ||||
Swinton North
| Party | Candidate | Votes | % | ±% | |
|---|---|---|---|---|---|
| Labour | Bill Hinds* | 1,385 | 60.5 | ||
| Conservative | Andy Cheetham | 513 | 22.4 | ||
| UKIP | Andy Olsen | 168 | 7.3 | ||
| Green | Liam Waite | 131 | 5.7 | ||
| Liberal Democrats | Adam Slack | 91 | 4.0 | ||
| Majority | 872 | 38.1 | |||
| Turnout | 2,292 | 27.34 | |||
| Labour hold | Swing | ||||
Swinton South
| Party | Candidate | Votes | % | ±% | |
|---|---|---|---|---|---|
| Labour | Stuart Dickman | 1,185 | 53.6 | ||
| Conservative | Adam Carney | 491 | 22.2 | ||
| English Democrat | Craig Holmes | 163 | 7.4 | ||
| Green | Nicola Smith | 137 | 6.2 | ||
| SDP | Joe O’Neill | 130 | 5.9 | ||
| Liberal Democrats | Jade O’Neil | 103 | 4.7 | ||
| Majority | 694 | 31.4 | |||
| Turnout | 2,544 | 26.56 | |||
| Labour gain from Independent | Swing | ||||
Walkden North
| Party | Candidate | Votes | % | ±% | |
|---|---|---|---|---|---|
| Labour Co-op | Adrian Brocklehurst* | 1,201 | 53.9 | ||
| Conservative | James Macdonald | 421 | 18.9 | ||
| UKIP | Bernard Gill | 148 | 6.6 | ||
| Green | Diana Battersby | 114 | 5.1 | ||
| Liberal Democrats | Joseph Harmer | 73 | 3.3 | ||
| Majority | 780 | 35.0 | |||
| Turnout | 1,961 | 24.48 | |||
| Labour Co-op hold | Swing | ||||
Walkden South
| Party | Candidate | Votes | % | ±% | |
|---|---|---|---|---|---|
| Labour | Laura Edwards | 1,460 | 50.5 | ||
| Conservative | Anne Broomhead | 1,157 | 40.0 | ||
| Green | Thomas Dylan | 159 | 5.5 | ||
| Liberal Democrats | David Cowpe | 113 | 3.9 | ||
| Majority | 303 | 10.5 | |||
| Turnout | 2,895 | 35.30 | |||
| Labour gain from Conservative | Swing | ||||
Weaste and Seedley
| Party | Candidate | Votes | % | ±% | |
|---|---|---|---|---|---|
| Labour Co-op | Ronnie Wilson* | 1,302 | 59.8 | ||
| Conservative | Nicky Turner | 390 | 17.9 | ||
| UKIP | Barrie Fallows | 205 | 9.4 | ||
| Liberal Democrats | Andy Markham | 147 | 6.7 | ||
| Green | Rob Stephenson | 134 | 6.2 | ||
| Majority | 912 | 41.9 | |||
| Turnout | 2,185 | 23.52 | |||
| Labour Co-op hold | Swing | ||||
Winton
| Party | Candidate | Votes | % | ±% | |
|---|---|---|---|---|---|
| Labour | Margaret Morris* | 1,323 | 63.5 | ||
| Conservative | George Darlington | 417 | 20.0 | ||
| Green | Jenna Murray | 129 | 6.2 | ||
| UKIP | Brian Robinson | 116 | 5.6 | ||
| Liberal Democrats | Stuart Thomas | 53 | 2.5 | ||
| TUSC | Sally Griffiths | 46 | 2.2 | ||
| Majority | 906 | 43.5 | |||
| Turnout | 2,091 | 23.09 | |||
| Labour hold | Swing | ||||
Worsley
| Party | Candidate | Votes | % | ±% | |
|---|---|---|---|---|---|
| Conservative | Les Turner | 1,705 | 59.0 | ||
| Labour | Tony Davies | 841 | 29.1 | ||
| Liberal Democrats | Sara Ryder | 185 | 6.4 | ||
| Green | Christopher Bertenshaw | 158 | 5.5 | ||
| Majority | 864 | 29.9 | |||
| Turnout | 2,896 | 35.56 | |||
| Conservative hold | Swing | ||||
References
- 1 2 "Election results". salford.gov.uk/. Salford City Council. Archived from the original on 9 May 2018. Retrieved 9 May 2018.
- ↑ "Your councillors by political party". salford.gov.uk. Salford City Council. Archived from the original on 9 May 2018. Retrieved 9 May 2018.
This article is issued from Wikipedia. The text is licensed under Creative Commons - Attribution - Sharealike. Additional terms may apply for the media files.