Huadian
桦甸市 | |
|---|---|
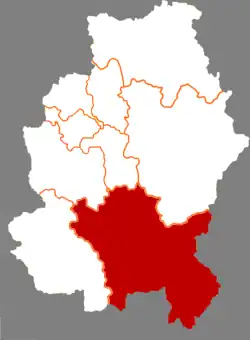 Huadian of the city center in Jilin City | |
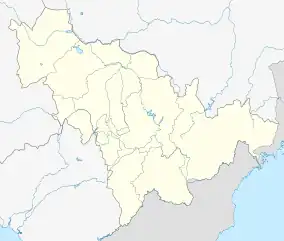 Huadian Location in Jilin | |
| Coordinates: 42°58′19″N 126°44′46″E / 42.972°N 126.746°E | |
| Country | People's Republic of China |
| Province | Jilin |
| Prefecture-level city | Jilin City |
| Seat | Minghua Subdistrict (明桦街道) |
| Area | |
| • County-level city | 6,624 km2 (2,558 sq mi) |
| • Urban | 192.00 km2 (74.13 sq mi) |
| Elevation | 265 m (869 ft) |
| Population (2017)[1] | |
| • County-level city | 464,000 |
| • Urban | 161,300 |
| Time zone | UTC+8 (China Standard) |
| Postal code | 132400 |
| Area code | 0432 |
Huadian (simplified Chinese: 桦甸; traditional Chinese: 樺甸; pinyin: Huàdiàn) is a city in south-central Jilin province, People's Republic of China. It is under the administration of the prefecture-level city of Jilin City.
Administrative divisions
[2] Subdistricts:
- Minghua Subdistrict (明桦街道), Yongji Subdistrict (永吉街道), Shengli Subdistrict (胜利街道), Qixin Subdistrict (启新街道), Xinhua Subdistrict (新华街道)
Towns:
- Hongshi (红石镇), Baishan (白山镇), Jiapigou (夹皮沟镇), Erdaodianzi (二道甸子镇), Badaohezi (八道河子镇), Yumuqiaozi (榆木桥子镇), Laojinchang (老金厂镇), Changshan (常山镇)
Townships:
- Gongji Township (公吉乡), Huajiao Township (桦郊乡), Jinsha Township (金沙乡), Huashulinzi Township (桦树林子乡), Huanan Township (桦南乡), Sumigou Township (苏密沟乡), Beitaizi Township (北台子乡), Hengdaohezi Township (横道河子乡)
Climate
Huadian has a four-season, monsoon-influenced, humid continental climate (Köppen Dwa). Winters are long (lasting from November to March), cold, and windy, but dry, due to the influence of the Siberian anticyclone, with a January mean temperature of −17.7 °C (0.1 °F). Spring and autumn are somewhat short transitional periods, with some precipitation, but are usually dry and windy. Summers are hot and humid, with a prevailing southeasterly wind due to the East Asian monsoon; July averages 22.4 °C (72.3 °F). Snow is usually light during the winter, and annual rainfall is heavily concentrated from June to August.
| Climate data for Huadian (1991–2020 normals, extremes 1971–2010) | |||||||||||||
|---|---|---|---|---|---|---|---|---|---|---|---|---|---|
| Month | Jan | Feb | Mar | Apr | May | Jun | Jul | Aug | Sep | Oct | Nov | Dec | Year |
| Record high °C (°F) | 4.9 (40.8) |
13.4 (56.1) |
19.0 (66.2) |
30.2 (86.4) |
33.6 (92.5) |
35.5 (95.9) |
36.3 (97.3) |
33.5 (92.3) |
30.7 (87.3) |
29.0 (84.2) |
20.4 (68.7) |
9.8 (49.6) |
36.3 (97.3) |
| Mean daily maximum °C (°F) | −8.9 (16.0) |
−3.4 (25.9) |
4.5 (40.1) |
14.6 (58.3) |
21.8 (71.2) |
26.0 (78.8) |
28.1 (82.6) |
27.0 (80.6) |
22.3 (72.1) |
14.2 (57.6) |
2.7 (36.9) |
−6.5 (20.3) |
11.9 (53.4) |
| Daily mean °C (°F) | −17.3 (0.9) |
−11.4 (11.5) |
−1.8 (28.8) |
7.6 (45.7) |
14.9 (58.8) |
20.1 (68.2) |
22.9 (73.2) |
21.5 (70.7) |
14.9 (58.8) |
6.6 (43.9) |
−3.5 (25.7) |
−13.6 (7.5) |
5.1 (41.1) |
| Mean daily minimum °C (°F) | −24.1 (−11.4) |
−18.7 (−1.7) |
−7.7 (18.1) |
0.9 (33.6) |
8.4 (47.1) |
14.8 (58.6) |
18.5 (65.3) |
17.3 (63.1) |
9.3 (48.7) |
0.6 (33.1) |
−8.6 (16.5) |
−19.7 (−3.5) |
−0.7 (30.6) |
| Record low °C (°F) | −44.1 (−47.4) |
−40.3 (−40.5) |
−31.0 (−23.8) |
−12.8 (9.0) |
−5.3 (22.5) |
4.8 (40.6) |
10.4 (50.7) |
4.6 (40.3) |
−3.4 (25.9) |
−13.1 (8.4) |
−29.2 (−20.6) |
−39.1 (−38.4) |
−44.1 (−47.4) |
| Average precipitation mm (inches) | 8.0 (0.31) |
13.1 (0.52) |
20.6 (0.81) |
38.7 (1.52) |
76.7 (3.02) |
123.9 (4.88) |
196.4 (7.73) |
170.6 (6.72) |
62.1 (2.44) |
40.9 (1.61) |
27.5 (1.08) |
16.4 (0.65) |
794.9 (31.29) |
| Average precipitation days (≥ 0.1 mm) | 7.5 | 6.0 | 7.8 | 9.2 | 13.3 | 14.7 | 15.5 | 14.7 | 10.0 | 9.7 | 8.9 | 8.9 | 126.2 |
| Average snowy days | 11.0 | 8.4 | 9.2 | 3.1 | 0 | 0 | 0 | 0 | 0 | 2.1 | 8.3 | 11.8 | 53.9 |
| Average relative humidity (%) | 70 | 67 | 62 | 57 | 62 | 71 | 80 | 82 | 78 | 71 | 71 | 71 | 70 |
| Mean monthly sunshine hours | 133.6 | 167.4 | 202.9 | 197.7 | 214.9 | 213.5 | 193.9 | 189.8 | 198.5 | 179.0 | 135.0 | 113.5 | 2,139.7 |
| Percent possible sunshine | 46 | 56 | 55 | 49 | 47 | 47 | 42 | 45 | 54 | 53 | 47 | 41 | 49 |
| Source 1: China Meteorological Administration[3][4] | |||||||||||||
| Source 2: Weather China[5] | |||||||||||||
References
- 1 2 Ministry of Housing and Urban-Rural Development, ed. (2019). China Urban Construction Statistical Yearbook 2017. Beijing: China Statistics Press. p. 50. Retrieved 11 January 2020.
- ↑ 吉林市-行政区划网. xzqh.org.
- ↑ 中国气象数据网 – WeatherBk Data (in Simplified Chinese). China Meteorological Administration. Retrieved 7 July 2023.
- ↑ 中国气象数据网 (in Simplified Chinese). China Meteorological Administration. Retrieved 7 July 2023.
- ↑ 桦甸 - 气象数据 -中国天气网 (in Chinese). Weather China. Retrieved 28 November 2022.
External links