Huili
会理市 · ꑌꄷꏃ | |
|---|---|
.png.webp) Location of Huili County (pink) and Liangshan Prefecture (yellow) within Sichuan | |
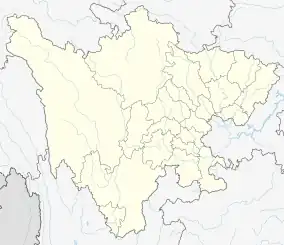 Huili Location in Sichuan 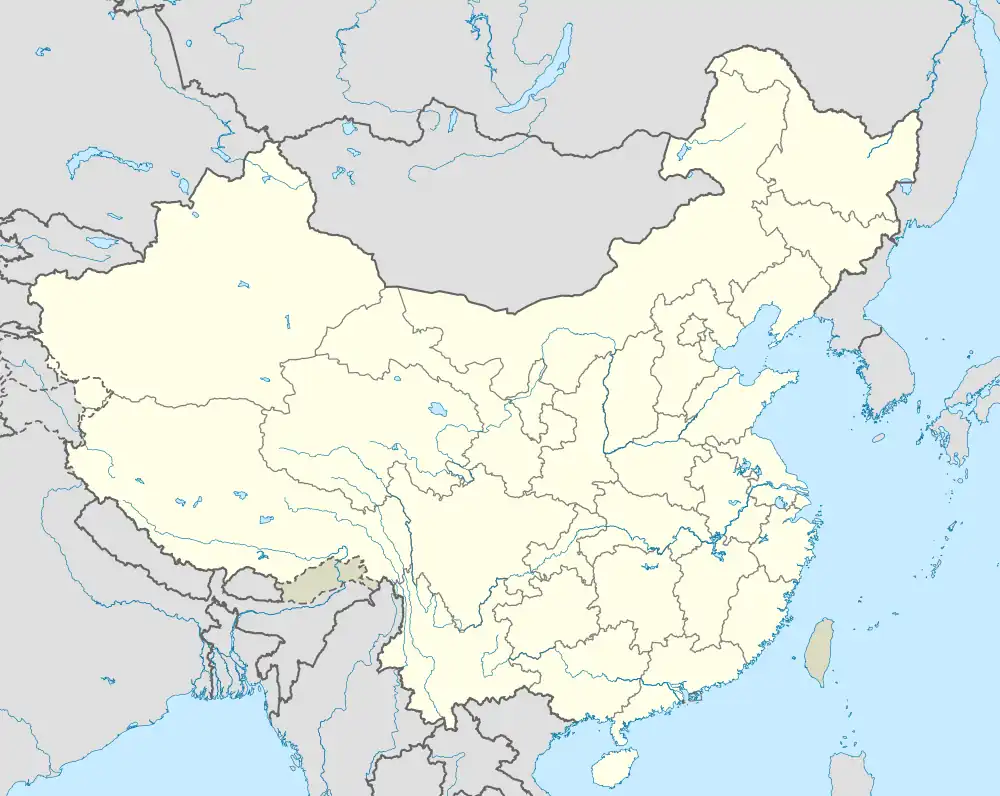 Huili Huili (China) | |
| Coordinates: 26°38′N 102°15′E / 26.633°N 102.250°E | |
| Country | China |
| Province | Sichuan |
| Autonomous prefecture | Liangshan |
| Municipal seat | Gucheng Subdistrict |
| Area | |
| • Total | 4,527 km2 (1,748 sq mi) |
| Elevation | 1,802 m (5,912 ft) |
| Population (2020)[1] | |
| • Total | 390,531 |
| • Density | 86/km2 (220/sq mi) |
| Time zone | UTC+8 (China Standard) |
| Area code | 0834 |
| Website | www |
| Huili | |||||||
|---|---|---|---|---|---|---|---|
| Chinese name | |||||||
| Simplified Chinese | 会理市 | ||||||
| Traditional Chinese | 會理市 | ||||||
| |||||||
| Yi name | |||||||
| Yi | ꑌꄷꏃ or ꉼꆹꏃ Romanisation: nyi ddix shyp or hop li shyp | ||||||
Huili (Chinese: 会理市; pinyin: Huìlǐ Shì; Yi: ꑌꄷꏃ or ꉼꆹꏃ nyi ddix shyp or hop li shyp) is a county-level city of far southern Sichuan province, China. It is under the administration of the Liangshan Yi Autonomous Prefecture.
Formerly Huili County (会理县, ꑌꄷꑤ), it was upgraded to a county-level city in May 2022.
Huili was severely affected by the 2008 Panzhihua earthquake.[2]
Administrative divisions
Huili comprises 7 subdistricts, 11 towns, 6 townships and 2 ethnic townships.
| Name | Simplified Chinese | Hanyu Pinyin | Yi | Romanized Yi | Administrative division code | |
|---|---|---|---|---|---|---|
| Subdistricts | ||||||
| Chengbei Subdistrict | 城北街道 | Chéngběi Jiēdào | ꍰꀙꏦꈜ | chep bip jie gga | 513402001 | |
| Chengnan Subdistrict | 城南街道 | Chéngnán Jiēdào | ꀙꇨꏦꈜ | bip guo jie gga | 513402002 | |
| Gucheng Subdistrict | 古城街道 | Gǔchéng Jiēdào | ꀊꆨꇓꈓꏦꈜ | a hlex lur kur jie gga | 513402003 | |
| Towns | ||||||
| Luchang Town | 鹿厂镇 | Lùchǎng Zhèn | ꇑꍣꍔ | lup cha zhep | 513402101 | |
| Lixi Town | 黎溪镇 | Líxī Zhèn | ꆀꑭꍔ | nip xy zhep | 513402102 | |
| Tong'an Town | 通安镇 | Tōng'ān Zhèn | ꄫꉢꍔ | to nga zhep | 513402103 | |
| Taiping Town | 太平镇 | Tàipíng Zhèn | ꄠꀻꍔ | tiep pip zhep | 513402104 | |
| Yimen Town | 益门镇 | Yìmén Zhèn | ꒊꂿꍔ | yyp mo zhep | 513402105 | |
| Lüshui Town | 绿水镇 | Lǜshuǐ Zhèn | ꇑꎴꍔ | lup sho zhep | 513402106 | |
| Yundian Town | 云甸镇 | Yúndiàn Zhèn | ꑴꄆꍔ | yip diep zhep | 513402107 | |
| Xinfa Town | 新发镇 | Xīnfā Zhèn | ꑭꃔꍔ | xy fap zhep | 513402108 | |
| Guanhe Town | 关河镇 | Guānhé Zhèn | ꇨꉼꍔ | guo hop zhep | 513402109 | |
| Zhangguan Town | 彰冠镇 | Zhāngguàn Zhèn | ꍈꇨꍔ | zha guo zhep | 513402110 | |
| Mugu Town | 木古镇 | Mùgǔ Zhèn | ꃆꇴꍔ | mup gu zhep | 513402111 | |
| Liuhua Town | 六华镇 | Liùhuá Zhèn | ꇑꉸꍔ | lup huop zhep | 513402112 | |
| Xiaoheiqing Town | 小黑箐镇 | Xiǎohēiqìng Zhèn | ꑦꉿꏿꍔ | xuo hep qip zhep | 513402113 | |
| Townships | ||||||
| Neidong Township | 内东乡 | Nèidōng Xiāng | ꇊꄏꑣ | lop do xie | 513402201 | |
| Shubao Township | 树堡乡 | Shùbǎo Xiāng | ꎽꀦꑣ | shup box xie | 513402202 | |
| Caoyuan Township | 槽元乡 | Cáoyuán Xiāng | ꊼꑼꑣ | cuop yuop xie | 513402204 | |
| Ethnic township | ||||||
| Xin'an Dai Ethnic Township | 新安傣族乡 | Xīn'ān Dǎizú Xiāng | ꑭꉢꄅꊥꑣ | xy nga die zup xie | 513402203 | |
Geography and climate
Huili is situated in southern Sichuan and is the southernmost division of the Liangshan Prefecture, bordering Sichuan's Panzhihua City and Yunnan. The county-level city seat has an elevation of about 1,800 m (5,900 ft), although elevations range from 839 m (2,753 ft) along the Jinsha River to 3,920 m (12,860 ft) at Mount Beimu (贝母山).
Due to its southerly location in Sichuan and high elevation, Huili has a subtropical highland climate (Köppen Cwb), with mild, very sunny and dry winters, and very warm, rainy summers. The monthly 24-hour average temperature ranges from 7.3 °C (45.1 °F) in January to 21.1 °C (70.0 °F) in June, and the annual mean is 15.23 °C (59.4 °F). Over 60% of the 1,162 mm (45.7 in) annual precipitation occurs from June to August. With monthly percent possible sunshine ranging from 34% in July to 72% in February, the county-level city seat receives 2,348 hours of bright sunshine annually.
| Climate data for Huili (1991–2020 normals, extremes 1981–2010) | |||||||||||||
|---|---|---|---|---|---|---|---|---|---|---|---|---|---|
| Month | Jan | Feb | Mar | Apr | May | Jun | Jul | Aug | Sep | Oct | Nov | Dec | Year |
| Record high °C (°F) | 23.2 (73.8) |
25.2 (77.4) |
28.5 (83.3) |
31.6 (88.9) |
34.0 (93.2) |
33.8 (92.8) |
32.7 (90.9) |
30.8 (87.4) |
31.2 (88.2) |
27.9 (82.2) |
25.1 (77.2) |
22.5 (72.5) |
34.0 (93.2) |
| Mean daily maximum °C (°F) | 16.4 (61.5) |
18.9 (66.0) |
22.3 (72.1) |
25.1 (77.2) |
26.6 (79.9) |
26.7 (80.1) |
26.1 (79.0) |
26.3 (79.3) |
24.4 (75.9) |
22.0 (71.6) |
19.1 (66.4) |
16.2 (61.2) |
22.5 (72.5) |
| Daily mean °C (°F) | 7.6 (45.7) |
10.2 (50.4) |
13.9 (57.0) |
17.2 (63.0) |
20.2 (68.4) |
21.5 (70.7) |
21.0 (69.8) |
20.7 (69.3) |
18.9 (66.0) |
16.2 (61.2) |
11.6 (52.9) |
8.0 (46.4) |
15.6 (60.1) |
| Mean daily minimum °C (°F) | 1.1 (34.0) |
3.0 (37.4) |
6.5 (43.7) |
10.1 (50.2) |
14.5 (58.1) |
17.6 (63.7) |
17.8 (64.0) |
17.1 (62.8) |
15.7 (60.3) |
12.6 (54.7) |
6.5 (43.7) |
2.2 (36.0) |
10.4 (50.7) |
| Record low °C (°F) | −4.2 (24.4) |
−3.9 (25.0) |
−3.6 (25.5) |
3.1 (37.6) |
4.9 (40.8) |
11.2 (52.2) |
11.9 (53.4) |
9.5 (49.1) |
7.0 (44.6) |
4.0 (39.2) |
−2.0 (28.4) |
−5.7 (21.7) |
−5.7 (21.7) |
| Average precipitation mm (inches) | 11.2 (0.44) |
7.6 (0.30) |
13.7 (0.54) |
23.8 (0.94) |
83.5 (3.29) |
201.7 (7.94) |
277.2 (10.91) |
215.4 (8.48) |
191.8 (7.55) |
89.4 (3.52) |
20.7 (0.81) |
4.4 (0.17) |
1,140.4 (44.89) |
| Average precipitation days (≥ 0.1 mm) | 2.3 | 3.0 | 4.6 | 6.3 | 11.8 | 17.7 | 20.5 | 18.7 | 18.1 | 12.3 | 5.6 | 2.5 | 123.4 |
| Average relative humidity (%) | 63 | 56 | 51 | 53 | 59 | 72 | 80 | 79 | 80 | 77 | 73 | 70 | 68 |
| Mean monthly sunshine hours | 233.4 | 226.5 | 256.7 | 252.5 | 231.9 | 157.0 | 143.6 | 170.3 | 127.4 | 152.1 | 186.4 | 210.1 | 2,347.9 |
| Percent possible sunshine | 71 | 72 | 69 | 66 | 56 | 38 | 34 | 42 | 35 | 43 | 57 | 65 | 53 |
| Source: China Meteorological Administration[3][4][5] | |||||||||||||
References
- ↑ "凉山州第七次全国人口普查公报(第二号)——县(市)人口情况" (in Chinese). Government of Liangshan Prefecture. 2021-06-02.
- ↑ "China: Earthquake in Sichuan and Yunnan" (PDF). International Federation of Red Cross and Red Crescent Societies. 2 September 2008. Retrieved 30 June 2011.
- ↑ 中国气象数据网 – WeatherBk Data (in Simplified Chinese). China Meteorological Administration. Retrieved 17 September 2023.
- ↑ 中国气象数据网 (in Simplified Chinese). China Meteorological Administration. Retrieved 17 September 2023.
- ↑ 中国地面国际交换站气候标准值月值数据集(1971-2000年). China Meteorological Administration. Archived from the original on 2013-09-21. Retrieved 2010-05-25.