Pata
ڤات | |
|---|---|
| Municipality of Pata | |
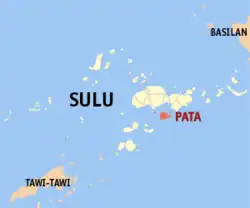 Map of Sulu with Pata highlighted | |
OpenStreetMap | |
.svg.png.webp) Pata Location within the Philippines | |
| Coordinates: 5°50′40″N 121°08′38″E / 5.844408°N 121.143861°E | |
| Country | Philippines |
| Region | Bangsamoro Autonomous Region in Muslim Mindanao |
| Province | Sulu |
| District | 2nd district |
| Barangays | 14 (see Barangays) |
| Government | |
| • Type | Sangguniang Bayan |
| • Mayor | Abdurauf C. Burahan |
| • Vice Mayor | Anton J. Burahan |
| • Representative | Munir N. Arbison Jr. |
| • Municipal Council | Members |
| • Electorate | 7,269 voters (2022) |
| Area | |
| • Total | 116.99 km2 (45.17 sq mi) |
| Elevation | 18 m (59 ft) |
| Highest elevation | 796 m (2,612 ft) |
| Lowest elevation | 0 m (0 ft) |
| Population (2020 census)[3] | |
| • Total | 24,736 |
| • Density | 210/km2 (550/sq mi) |
| • Households | 4,169 |
| Economy | |
| • Income class | 5th municipal income class |
| • Poverty incidence | 87.31 |
| • Revenue | ₱ 99.89 million (2020) |
| • Assets | ₱ 166.4 million (2020) |
| • Expenditure | ₱ 66.26 million (2020) |
| • Liabilities | ₱ 7.995 million (2020) |
| Service provider | |
| • Electricity | Sulu Electric Cooperative (SULECO) |
| Time zone | UTC+8 (PST) |
| ZIP code | 7405 |
| PSGC | |
| IDD : area code | +63 (0)68 |
| Native languages | Tausug Tagalog |
Pata, officially the Municipality of Pata (Tausūg: Kawman sin Pata; Tagalog: Bayan ng Pata), is a 5th class municipality in the province of Sulu, Philippines. According to the 2015 census, it has a population of 22,163 people.[5]
Geography
Barangays
Pata is politically subdivided into 14 barangays. Each barangay consists of puroks while some have sitios.
- Andalan
- Daungdong
- Kamawi
- Kanjarang
- Kayawan
- Kiput
- Likud
- Luuk-tulay
- Niog-niog
- Patian
- Pisak-pisak
- Saimbangon (Poblacion)
- Sangkap
- Timuddas
Climate
| Climate data for Pata, Sulu | |||||||||||||
|---|---|---|---|---|---|---|---|---|---|---|---|---|---|
| Month | Jan | Feb | Mar | Apr | May | Jun | Jul | Aug | Sep | Oct | Nov | Dec | Year |
| Mean daily maximum °C (°F) | 27 (81) |
27 (81) |
27 (81) |
28 (82) |
28 (82) |
28 (82) |
28 (82) |
28 (82) |
28 (82) |
28 (82) |
28 (82) |
28 (82) |
28 (82) |
| Mean daily minimum °C (°F) | 27 (81) |
26 (79) |
27 (81) |
27 (81) |
28 (82) |
28 (82) |
28 (82) |
28 (82) |
28 (82) |
28 (82) |
28 (82) |
27 (81) |
28 (81) |
| Average precipitation mm (inches) | 170 (6.7) |
130 (5.1) |
125 (4.9) |
122 (4.8) |
229 (9.0) |
286 (11.3) |
254 (10.0) |
248 (9.8) |
182 (7.2) |
257 (10.1) |
233 (9.2) |
188 (7.4) |
2,424 (95.5) |
| Average rainy days | 18.3 | 15.3 | 15.2 | 14.6 | 22.8 | 24.0 | 24.3 | 23.3 | 20.5 | 22.6 | 21.9 | 19.3 | 242.1 |
| Source: Meteoblue (modeled/calculated data, not measured locally)[6] | |||||||||||||
Demographics
| Year | Pop. | ±% p.a. |
|---|---|---|
| 1939 | 9,105 | — |
| 1948 | 6,795 | −3.20% |
| 1960 | 6,657 | −0.17% |
| 1970 | 8,077 | +1.95% |
| 1975 | 4,379 | −11.55% |
| 1980 | 7,213 | +10.49% |
| 1990 | 9,244 | +2.51% |
| 1995 | 10,065 | +1.61% |
| 2000 | 11,791 | +3.45% |
| 2007 | 20,095 | +7.63% |
| 2010 | 14,918 | −10.27% |
| 2015 | 22,163 | +7.83% |
| 2020 | 24,736 | +2.18% |
| Source: Philippine Statistics Authority[5][7][8][9] | ||
Economy
References
- ↑ Municipality of Pata | (DILG)
- ↑ "2015 Census of Population, Report No. 3 – Population, Land Area, and Population Density" (PDF). Philippine Statistics Authority. Quezon City, Philippines. August 2016. ISSN 0117-1453. Archived (PDF) from the original on May 25, 2021. Retrieved July 16, 2021.
- ↑ Census of Population (2020). "Bangsamoro (BARMM)". Total Population by Province, City, Municipality and Barangay. Philippine Statistics Authority. Retrieved 8 July 2021.
- ↑ "PSA Releases the 2018 Municipal and City Level Poverty Estimates". Philippine Statistics Authority. 15 December 2021. Retrieved 22 January 2022.
- 1 2 Census of Population (2015). "ARMM – Autonomous Region in Muslim Mindanao". Total Population by Province, City, Municipality and Barangay. Philippine Statistics Authority. Retrieved 20 June 2016.
- ↑ "Pata, Sulu : Average Temperatures and Rainfall". Meteoblue. Retrieved 31 January 2019.
- ↑ Census of Population and Housing (2010). "ARMM – Autonomous Region in Muslim Mindanao" (PDF). Total Population by Province, City, Municipality and Barangay. National Statistics Office. Retrieved 29 June 2016.
- ↑ Censuses of Population (1903–2007). "ARMM – Autonomous Region in Muslim Mindanao". Table 1. Population Enumerated in Various Censuses by Province/Highly Urbanized City: 1903 to 2007. National Statistics Office.
{{cite encyclopedia}}: CS1 maint: numeric names: authors list (link) - ↑ "Province of Sulu". Municipality Population Data. Local Water Utilities Administration Research Division. Retrieved 17 December 2016.
- ↑ "Poverty incidence (PI):". Philippine Statistics Authority. Retrieved December 28, 2020.
- ↑ "Estimation of Local Poverty in the Philippines" (PDF). Philippine Statistics Authority. 29 November 2005.
- ↑ "2003 City and Municipal Level Poverty Estimates" (PDF). Philippine Statistics Authority. 23 March 2009.
- ↑ "City and Municipal Level Poverty Estimates; 2006 and 2009" (PDF). Philippine Statistics Authority. 3 August 2012.
- ↑ "2012 Municipal and City Level Poverty Estimates" (PDF). Philippine Statistics Authority. 31 May 2016.
- ↑ "Municipal and City Level Small Area Poverty Estimates; 2009, 2012 and 2015". Philippine Statistics Authority. 10 July 2019.
- ↑ "PSA Releases the 2018 Municipal and City Level Poverty Estimates". Philippine Statistics Authority. 15 December 2021. Retrieved 22 January 2022.
External links
- Pata Profile at PhilAtlas.com
- Philippine Standard Geographic Code
- Pata Profile at the DTI Cities and Municipalities Competitive Index
- Philippine Census Information
- Local Governance Performance Management System
Places adjacent to Pata, Sulu | ||||||||||||||||
|---|---|---|---|---|---|---|---|---|---|---|---|---|---|---|---|---|
| ||||||||||||||||
Jolo (capital and largest municipality) | |
| Municipalities | |
This article is issued from Wikipedia. The text is licensed under Creative Commons - Attribution - Sharealike. Additional terms may apply for the media files.