Tarata | |
|---|---|
 Flag  Coat of arms | |
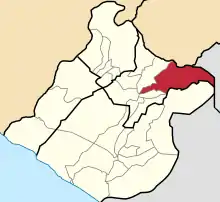 Location of Tarata in the Tarata Province | |
| Country | |
| Region | Tacna |
| Province | Tarata |
| Capital | Tarata |
| Government | |
| • Mayor | José Luis Ticona Sanjinez |
| Area | |
| • Total | 864.31 km2 (333.71 sq mi) |
| Elevation | 3,068 m (10,066 ft) |
| Population | |
| • Total | 3,605 |
| • Density | 4.2/km2 (11/sq mi) |
| Time zone | UTC-5 (PET) |
| UBIGEO | 230401 |
Tarata District is one of eight districts of Tarata Province in Peru.[1]
Geography
The Barroso mountain range traverses the district. Some of the highest mountains of the district are listed below:[2]
- Antajawi
- Chaka
- Chunta Qullu
- Ch'uxñuma
- Inka Apachita
- Iñuma
- Juqhuri
- Khuruña
- Laram Qullu
- Lluqu Qullu
- Pä Qullu
- Phusnu Pullawi
- Tawa Qullu
- Titiri
- Wallatiri
- Warawarani
- Wila Qullu
- Wila Uqharani
- Wiqu
Climate
| Climate data for Tarata (elevation 3,100 m (10,200 ft), 1991–2020 normals) | |||||||||||||
|---|---|---|---|---|---|---|---|---|---|---|---|---|---|
| Month | Jan | Feb | Mar | Apr | May | Jun | Jul | Aug | Sep | Oct | Nov | Dec | Year |
| Mean daily maximum °C (°F) | 19.8 (67.6) |
19.6 (67.3) |
20.2 (68.4) |
21.0 (69.8) |
20.8 (69.4) |
20.6 (69.1) |
20.3 (68.5) |
20.9 (69.6) |
21.1 (70.0) |
21.1 (70.0) |
20.9 (69.6) |
20.7 (69.3) |
20.6 (69.1) |
| Mean daily minimum °C (°F) | 6.4 (43.5) |
6.6 (43.9) |
5.5 (41.9) |
3.2 (37.8) |
1.0 (33.8) |
1.0 (33.8) |
1.7 (35.1) |
2.5 (36.5) |
3.4 (38.1) |
3.7 (38.7) |
4.0 (39.2) |
5.3 (41.5) |
3.7 (38.7) |
| Average precipitation mm (inches) | 69.1 (2.72) |
82.4 (3.24) |
36.2 (1.43) |
1.9 (0.07) |
0.8 (0.03) |
0.5 (0.02) |
1.0 (0.04) |
1.0 (0.04) |
1.1 (0.04) |
0.4 (0.02) |
0.3 (0.01) |
12.4 (0.49) |
207.1 (8.15) |
| Source: National Meteorology and Hydrology Service of Peru[3] | |||||||||||||
| Climate data for Chuapalca (elevation 4,250 m (13,940 ft), 1991–2020 normals) | |||||||||||||
|---|---|---|---|---|---|---|---|---|---|---|---|---|---|
| Month | Jan | Feb | Mar | Apr | May | Jun | Jul | Aug | Sep | Oct | Nov | Dec | Year |
| Mean daily maximum °C (°F) | 15.9 (60.6) |
15.7 (60.3) |
16.0 (60.8) |
16.0 (60.8) |
14.7 (58.5) |
14.1 (57.4) |
13.4 (56.1) |
14.8 (58.6) |
16.2 (61.2) |
17.6 (63.7) |
18.8 (65.8) |
18.1 (64.6) |
15.9 (60.7) |
| Mean daily minimum °C (°F) | −1.9 (28.6) |
−1.3 (29.7) |
−2.8 (27.0) |
−6.9 (19.6) |
−11.3 (11.7) |
−13.5 (7.7) |
−13.6 (7.5) |
−13.3 (8.1) |
−11.1 (12.0) |
−9.7 (14.5) |
−9.1 (15.6) |
−5.0 (23.0) |
−8.3 (17.1) |
| Average precipitation mm (inches) | 114.6 (4.51) |
109.4 (4.31) |
72.7 (2.86) |
18.7 (0.74) |
2.2 (0.09) |
1.7 (0.07) |
2.6 (0.10) |
3.5 (0.14) |
2.7 (0.11) |
7.3 (0.29) |
15.7 (0.62) |
61.9 (2.44) |
413 (16.28) |
| Source: National Meteorology and Hydrology Service of Peru[3] | |||||||||||||
References
- ↑ (in Spanish) Instituto Nacional de Estadística e Informática. Banco de Información Distrital Archived 2008-04-23 at the Wayback Machine. Retrieved April 11, 2008.
- ↑ escale.minedu.gob.pe - UGEL map of the Tarata Province (Tacna Region)
- 1 2 "Normales Climaticás Estándares y Medias 1991-2020". National Meteorology and Hydrology Service of Peru. Archived from the original on 21 August 2023. Retrieved 6 November 2023.
| |
|---|---|
| Candarave | |
| Jorge Basadre | |
| Tacna | |
| Tarata | |
This article is issued from Wikipedia. The text is licensed under Creative Commons - Attribution - Sharealike. Additional terms may apply for the media files.