| |||||||||||||||||||||||||||||||||||||||||||||||||||||
All 58 seats to Edinburgh City Council 30 seats needed for a majority | |||||||||||||||||||||||||||||||||||||||||||||||||||||
|---|---|---|---|---|---|---|---|---|---|---|---|---|---|---|---|---|---|---|---|---|---|---|---|---|---|---|---|---|---|---|---|---|---|---|---|---|---|---|---|---|---|---|---|---|---|---|---|---|---|---|---|---|---|
| Turnout | 61.0 ( | ||||||||||||||||||||||||||||||||||||||||||||||||||||
| |||||||||||||||||||||||||||||||||||||||||||||||||||||
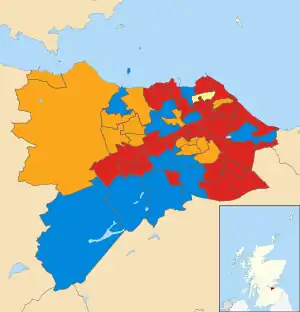 Map of council wards | |||||||||||||||||||||||||||||||||||||||||||||||||||||
| |||||||||||||||||||||||||||||||||||||||||||||||||||||
Elections to the City of Edinburgh Council were held on 6 May 1999, the same day as the other Scottish local government elections and the Scottish Parliament general election. Turnout was 61%, an increase of 16.5% on the 1995 turnout.
| Party | Seats | Gains | Losses | Net gain/loss | Seats % | Votes % | Votes | +/− | |
|---|---|---|---|---|---|---|---|---|---|
| Labour | 31 | 32.5 | 73,003 | ||||||
| Liberal Democrats | 13 | 24.4 | 54,791 | ||||||
| Conservative | 13 | 22.5 | 50,630 | ||||||
| SNP | 1 | 1.7 | 20.5 | 46,184 | |||||
| Independent | 0 | 0.0 | 0.1 | 211 | |||||
References
- ↑ "Politics | Edinburgh News". www.edinburghnews.scotsman.com.
- ↑ Bochel, H.M.; Denver, D.T., eds. (1999). Scottish Council Elections 1999 (PDF). Newport-on-Tay, Scotland: Election Studies. pp. 91–93. ISBN 978-1-869820-40-4. Retrieved 10 June 2021.
| Edinburgh Corporation |
|
|---|---|
| City of Edinburgh District Council | |
| Lothian Regional Council | |
| City of Edinburgh Council | |
| Referendums | |
This article is issued from Wikipedia. The text is licensed under Creative Commons - Attribution - Sharealike. Additional terms may apply for the media files.