| |||||||||||||||||||||||||||||
All 39 seats to Stevenage Borough Council 20 seats needed for a majority | |||||||||||||||||||||||||||||
|---|---|---|---|---|---|---|---|---|---|---|---|---|---|---|---|---|---|---|---|---|---|---|---|---|---|---|---|---|---|
| Turnout | 29.9% | ||||||||||||||||||||||||||||
| |||||||||||||||||||||||||||||
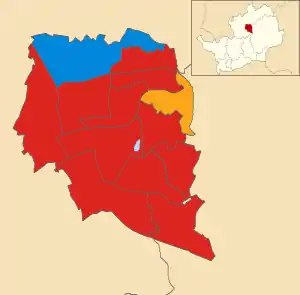 Map showing the results of contested wards in the 1999 Stevenage Borough Council elections. | |||||||||||||||||||||||||||||
| |||||||||||||||||||||||||||||
Elections to Stevenage Council were held on 6 May 1999. The whole council was up for election with boundary changes since the last election in 1998. The Labour Party stayed in overall control of the council.
Election result
| Party | Seats | Gains | Losses | Net gain/loss | Seats % | Votes % | Votes | +/− | |
|---|---|---|---|---|---|---|---|---|---|
| Labour | 33 | -4 | 84.6 | ||||||
| Liberal Democrats | 3 | +1 | 7.7 | ||||||
| Conservative | 3 | +3 | 7.7 | ||||||
Ward results
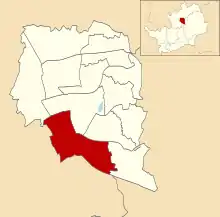
Bandley Hill

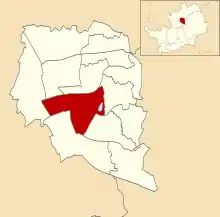
Location of Bandley Hill ward
| Party | Candidate | Votes | % | |
|---|---|---|---|---|
| Labour | Robert Woodward | 789 | ||
| Labour | Joan Lloyd | 774 | ||
| Labour | Lilian Strange | 764 | ||
| Conservative | Sherree Kerby | 238 | ||
| Conservative | Claire Halling | 234 | ||
| Socialist Alternative | Jean Halling | 62 | ||
| Turnout | 23% | |||
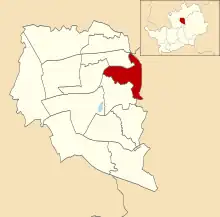
Bedwell
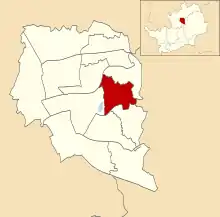
Location of Bedwell ward
| Party | Candidate | Votes | % | |
|---|---|---|---|---|
| Labour | Elizabeth Harrington | 1,135 | ||
| Labour | David Cullen | 1,097 | ||
| Labour | Brian Underwood | 1,097 | ||
| Conservative | James Bellers | 235 | ||
| Liberal Democrats | George Robbins | 262 | ||
| Liberal Democrats | Sydney Grubert | 246 | ||
| Turnout | 31% | |||
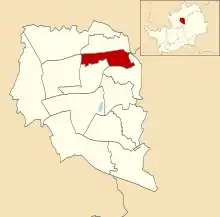
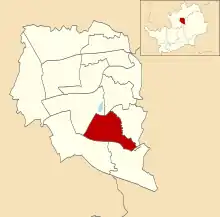
Chells
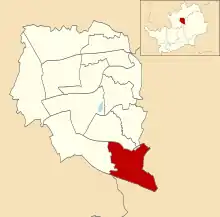
Location of Chells ward
| Party | Candidate | Votes | % | |
|---|---|---|---|---|
| Labour | Kenneth Vale | 861 | ||
| Labour | Pamela Stuart | 854 | ||
| Labour | Gill Tuffin | 830 | ||
| Liberal Democrats | Leonard Lambert | 355 | ||
| Liberal Democrats | Tracey MacFadyen | 332 | ||
| Liberal Democrats | Steve Destafeno | 282 | ||
| Conservative | Susan Smith | 190 | ||
| Turnout | 28% | |||
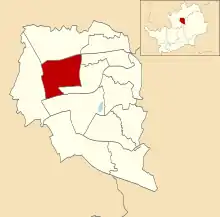
Longmeadow
Location of Longmeadow ward
| Party | Candidate | Votes | % | |
|---|---|---|---|---|
| Labour | Ann Webb | 749 | ||
| Labour | Suzanne Myson | 710 | ||
| Labour | Bruce Jackson | 704 | ||
| Liberal Democrats | Patricia Akhurst | 392 | ||
| Conservative | Val Ovenden | 376 | ||
| Liberal Democrats | Margaret Latham | 329 | ||
| Liberal Democrats | Denise Baskerville | 314 | ||
| Green | Bill Hoyes | 102 | ||
| Turnout | 30% | |||
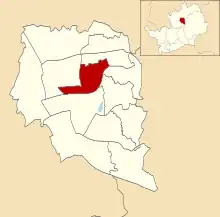
Manor
Location of Manor ward
| Party | Candidate | Votes | % | |
|---|---|---|---|---|
| Liberal Democrats | Robin Parker | 1,018 | ||
| Liberal Democrats | Lis Knight | 948 | ||
| Liberal Democrats | Graham Snell | 939 | ||
| Labour | Jeanette Thomas | 528 | ||
| Labour | Jacqueline Hollywell | 501 | ||
| Labour | Mahendran Chelvachandran | 479 | ||
| Conservative | Stuart Greaves | 460 | ||
| Conservative | Edward Hegan | 426 | ||
| Conservative | Gwen Hegan | 421 | ||
| Turnout | 43% | |||
Martins Wood
Location of Martins Wood ward
| Party | Candidate | Votes | % | |
|---|---|---|---|---|
| Labour | Michael Patston | 793 | ||
| Labour | Dave Monaghan | 776 | ||
| Labour | David Royall | 764 | ||
| Liberal Democrats | Barbara Segadelli | 427 | ||
| Turnout | 25% | |||
Old Town
Location of Old Town ward
| Party | Candidate | Votes | % | |
|---|---|---|---|---|
| Labour | Michael Downing | 969 | ||
| Labour | Pamela Gallagher | 966 | ||
| Labour | Hugh Tessier | 886 | ||
| Conservative | Victoria Greaves | 498 | ||
| Liberal Democrats | Jennifer Moorcroft | 433 | ||
| Turnout | 33% | |||
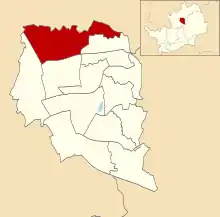
Pin Green
Location of Pin Green ward
| Party | Candidate | Votes | % | |
|---|---|---|---|---|
| Labour | Reg Smith | 1,003 | ||
| Labour | Tanis Kent | 981 | ||
| Labour | Simon Speller | 937 | ||
| Liberal Democrats | Heather Snell | 352 | ||
| Turnout | 28% | |||
Roebuck
Location of Roebuck ward
| Party | Candidate | Votes | % | |
|---|---|---|---|---|
| Labour | John Gardner | 742 | ||
| Labour | Alfred McCarthy | 734 | ||
| Labour | Brian Dunnell | 694 | ||
| Conservative | Matthew Hurst | 350 | ||
| Liberal Democrats | Peter Wilkins | 483 | ||
| Turnout | 28% | |||
St Nicholas

Location of St Nicholas ward
| Party | Candidate | Votes | % | |
|---|---|---|---|---|
| Labour | Judith Wallis Price | 768 | ||
| Labour | Stanley Munden | 753 | ||
| Labour | Richard Henry | 752 | ||
| Liberal Democrats | Mary Griffith | 388 | ||
| Conservative | Terri Woods | 295 | ||
| Turnout | 27% | |||
Shephall
Location of Shephall ward
| Party | Candidate | Votes | % | |
|---|---|---|---|---|
| Labour | Eddie Webb | 926 | ||
| Labour | Bob Clark | 895 | ||
| Labour | Brian Hall | 884 | ||
| Liberal Democrats | Gordon Knight | 241 | ||
| Conservative | Freda Warner | 229 | ||
| Turnout | 28% | |||
Symonds Green
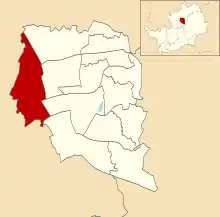
Location of Symonds Green ward
| Party | Candidate | Votes | % | |
|---|---|---|---|---|
| Labour | David Kissane | 988 | ||
| Labour | Sharon Taylor | 884 | ||
| Labour | Anthony Turner | 847 | ||
| Conservative | Margaret Notley | 402 | ||
| Conservative | Claire Halling | 376 | ||
| Conservative | Jean Halling | 363 | ||
| Liberal Democrats | Cecil Lewis | 181 | ||
| Turnout | 31% | |||
Woodfield
Location of Woodfield ward
| Party | Candidate | Votes | % | |
|---|---|---|---|---|
| Conservative | Graham Clark | 526 | ||
| Conservative | Marion Mason | 514 | ||
| Conservative | Peter McPartland | 510 | ||
| Labour | Caroline Latif | 424 | ||
| Labour | Patrick Newman | 417 | ||
| Labour | Omar Ismail | 374 | ||
| Liberal Democrats | Elizabeth Sturges | 145 | ||
| Turnout | 34% | |||
References
This article is issued from Wikipedia. The text is licensed under Creative Commons - Attribution - Sharealike. Additional terms may apply for the media files.