| |||||||||||||||||||||||||||||||||||||||||||||||||||||||||||||
All 31 seats to Bromsgrove District Council 16 seats needed for a majority | |||||||||||||||||||||||||||||||||||||||||||||||||||||||||||||
|---|---|---|---|---|---|---|---|---|---|---|---|---|---|---|---|---|---|---|---|---|---|---|---|---|---|---|---|---|---|---|---|---|---|---|---|---|---|---|---|---|---|---|---|---|---|---|---|---|---|---|---|---|---|---|---|---|---|---|---|---|---|
| |||||||||||||||||||||||||||||||||||||||||||||||||||||||||||||
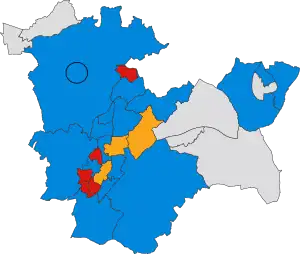 Winner of each seat at the 2019 Bromsgrove District Council election | |||||||||||||||||||||||||||||||||||||||||||||||||||||||||||||
| |||||||||||||||||||||||||||||||||||||||||||||||||||||||||||||
The 2019 Bromsgrove District Council election took place on 2 May 2019 to elect members of the Bromsgrove Council in England.[1] It was held on the same day as other local elections.
Summary
Election result
| 2019 Bromsgrove District Council election | ||||||||||
|---|---|---|---|---|---|---|---|---|---|---|
| Party | Candidates | Seats | Gains | Losses | Net gain/loss | Seats % | Votes % | Votes | +/− | |
| Conservative | 31 | 17 | 4 | 5 | 54.8 | 44.2 | 12,022 | –6.3 | ||
| Labour | 24 | 5 | 0 | 2 | 16.1 | 21.9 | 5,957 | –2.0 | ||
| Independent | 9 | 5 | 2 | 0 | 16.1 | 16.9 | 4,592 | +7.0 | ||
| Liberal Democrats | 14 | 3 | 3 | 0 | 9.7 | 10.3 | 2,792 | +8.1 | ||
| Residents | 4 | 1 | 0 | 2 | 3.2 | 5.0 | 1,357 | –1.2 | ||
| Green | 4 | 0 | 0 | 0 | 0.0 | 1.8 | 499 | –1.6 | ||
Ward results
Alvechurch South
| Party | Candidate | Votes | % | ±% | |
|---|---|---|---|---|---|
| Independent | Annette English | 563 | 52.9 | ||
| Conservative | Trevor Bland | 398 | 37.4 | ||
| Labour | Alan Cooper | 54 | 5.1 | ||
| Liberal Democrats | Dean Petters | 50 | 4.7 | ||
| Majority | |||||
| Turnout | 1,068 | 46.6 | |||
| Independent gain from Conservative | Swing | ||||
Alvechurch Village
| Party | Candidate | Votes | % | ±% | |
|---|---|---|---|---|---|
| Independent | Kathryn Van Der Plank | 840 | 84.8 | ||
| Conservative | Neil Harris | 104 | 10.5 | ||
| Labour | Louise Humphries | 46 | 4.6 | ||
| Majority | |||||
| Turnout | 994 | 44.1 | |||
| Independent gain from Conservative | Swing | ||||
Aston Fields
| Party | Candidate | Votes | % | ±% | |
|---|---|---|---|---|---|
| Conservative | Philip Thomas | 419 | 50.1 | ||
| Labour Co-op | Rory Shannon | 418 | 49.9 | ||
| Majority | |||||
| Turnout | 874 | 35.1 | |||
| Conservative hold | Swing | ||||
Avoncroft
| Party | Candidate | Votes | % | ±% | |
|---|---|---|---|---|---|
| Conservative | Malcolm Glass | 397 | 50.7 | ||
| Labour | John Ellis | 211 | 26.9 | ||
| Liberal Democrats | Lean-Nani Alconcel | 175 | 22.3 | ||
| Majority | |||||
| Turnout | 798 | 32.3 | |||
| Conservative hold | Swing | ||||
Barnt Green & Hopwood
| Party | Candidate | Votes | % | ±% | |
|---|---|---|---|---|---|
| Independent | Charles Hotham | 898 | 82.1 | ||
| Conservative | Mary Marsh | 196 | 17.9 | ||
| Majority | |||||
| Turnout | 1,100 | 46.4 | |||
| Independent hold | Swing | ||||
Belbroughton & Romsley
| Party | Candidate | Votes | % | ±% | |
|---|---|---|---|---|---|
| Conservative | Karen May | 1,322 | 76.5 | ||
| Conservative | Margarey Sherrey | 1,230 | 71.2 | ||
| Labour | Philip Baker | 309 | 17.9 | ||
| Labour | Caroline Thompson | 301 | 17.4 | ||
| Majority | |||||
| Turnout | 1,777 | 33.9 | |||
| Conservative hold | |||||
| Conservative hold | |||||
Bromsgrove Central
| Party | Candidate | Votes | % | ±% | |
|---|---|---|---|---|---|
| Liberal Democrats | Siobhan Hughes | 536 | 50.1 | ||
| Conservative | Rita Dent | 383 | 35.8 | ||
| Labour | Jane Elledge | 151 | 14.1 | ||
| Majority | 153 | 14.3 | |||
| Turnout | 1,083 | 46.1 | |||
| Liberal Democrats gain from Conservative | Swing | ||||
Catshill North
| Party | Candidate | Votes | % | ±% | |
|---|---|---|---|---|---|
| Conservative | Jo-Anne Till | 323 | 57.5 | ||
| Labour | Abdul Jilani | 239 | 42.5 | ||
| Majority | |||||
| Turnout | 577 | 26.4 | |||
| Conservative hold | Swing | ||||
Catshill South
| Party | Candidate | Votes | % | ±% | |
|---|---|---|---|---|---|
| Conservative | Shirley Webb | 339 | 59.1 | ||
| Labour | Matthew Osborne | 97 | 16.9 | ||
| Green | Julian Gray | 96 | 16.7 | ||
| Liberal Democrats | Sarah Mansell | 42 | 7.3 | ||
| Majority | |||||
| Turnout | 588 | 26.5 | |||
| Conservative hold | Swing | ||||
Charford
| Party | Candidate | Votes | % | ±% | |
|---|---|---|---|---|---|
| Labour | Michael Thompson | 469 | 76.8 | ||
| Conservative | Andrew Sherrey | 142 | 23.2 | ||
| Majority | |||||
| Turnout | 624 | 27.3 | |||
| Labour hold | Swing | ||||
Cofton
| Party | Candidate | Votes | % | ±% | |
|---|---|---|---|---|---|
| Conservative | Richard Deeming | 232 | 31.7 | ||
| Independent | Robin Van Der Plank | 208 | 28.5 | ||
| Green | Gillian Harvey | 130 | 17.8 | ||
| Labour | Antony Maslen | 91 | 12.4 | ||
| Liberal Democrats | Sara Woodhouse | 70 | 9.6 | ||
| Majority | |||||
| Turnout | 734 | 31.7 | |||
| Conservative hold | Swing | ||||
Drakes Cross
| Party | Candidate | Votes | % | ±% | |
|---|---|---|---|---|---|
| Residents | Susan Baxter | 460 | 58.2 | ||
| Conservative | Kathryn Powell | 330 | 41.8 | ||
| Majority | |||||
| Turnout | 802 | 32.5 | |||
| Residents hold | Swing | ||||
Hagley East
| Party | Candidate | Votes | % | ±% | |
|---|---|---|---|---|---|
| Independent | Rachel Jenkins | 727 | 76.8 | ||
| Conservative | Cameron Uppal | 219 | 23.2 | ||
| Majority | |||||
| Turnout | 958 | 40.8 | |||
| Independent hold | Swing | ||||
Hagley West
| Party | Candidate | Votes | % | ±% | |
|---|---|---|---|---|---|
| Independent | Steven Colella | 939 | 77.9 | ||
| Conservative | Kyle Daisley | 267 | 22.1 | ||
| Majority | |||||
| Turnout | 1,209 | 42.6 | |||
| Independent hold | Swing | ||||
Hill Top
| Party | Candidate | Votes | % | ±% | |
|---|---|---|---|---|---|
| Labour | Luke Mallett | 681 | 90.7 | ||
| Conservative | Suzanne Morgan | 70 | 9.3 | ||
| Majority | |||||
| Turnout | 761 | 42.4 | |||
| Labour hold | Swing | ||||
Hollywood
| Party | Candidate | Votes | % | ±% | |
|---|---|---|---|---|---|
| Conservative | Adam Kent | 490 | 56.6 | ||
| Residents | Keith Yates | 295 | 34.1 | ||
| Labour | Marian Leydon | 81 | 9.4 | ||
| Majority | |||||
| Turnout | 872 | 36.9 | |||
| Conservative gain from Residents | Swing | ||||
Lickey Hills
| Party | Candidate | Votes | % | ±% | |
|---|---|---|---|---|---|
| Liberal Democrats | Janet King | 484 | 56.4 | ||
| Conservative | Christopher Taylor | 374 | 43.6 | ||
| Majority | 110 | 12.8 | |||
| Turnout | 882 | 39.9 | |||
| Liberal Democrats gain from Conservative | Swing | ||||
Lowes Hill
| Party | Candidate | Votes | % | ±% | |
|---|---|---|---|---|---|
| Conservative | Rodney Laight | 372 | 46.6 | ||
| Labour | Brenda Henderson | 236 | 29.5 | ||
| Liberal Democrats | Rebecca Stevens | 191 | 23.9 | ||
| Majority | |||||
| Turnout | 818 | 31.6 | |||
| Conservative hold | Swing | ||||
Marlbrook
| Party | Candidate | Votes | % | ±% | |
|---|---|---|---|---|---|
| Conservative | Helen Jones | 474 | 56.4 | ||
| Green | Peter Harvey | 206 | 24.5 | ||
| Labour | Rosalind Cooke | 160 | 19.0 | ||
| Majority | |||||
| Turnout | 862 | 36.1 | |||
| Conservative hold | Swing | ||||
Norton
| Party | Candidate | Votes | % | ±% | |
|---|---|---|---|---|---|
| Liberal Democrats | Robert Hunter | 675 | 76.7 | ||
| Conservative | Jacqueline Alderson | 205 | 23.3 | ||
| Majority | 470 | 53.4 | |||
| Turnout | 904 | 39.6 | |||
| Liberal Democrats gain from Conservative | Swing | ||||
Perryfields
| Party | Candidate | Votes | % | ±% | |
|---|---|---|---|---|---|
| Conservative | Andrew Beaumont | 308 | 57.1 | ||
| Labour | Amy-Jane Thompson-Lancaster | 231 | 42.9 | ||
| Majority | |||||
| Turnout | 554 | 37.5 | |||
| Conservative hold | Swing | ||||
Rock Hill
| Party | Candidate | Votes | % | ±% | |
|---|---|---|---|---|---|
| Labour | Harrison Rone-Clarke | 337 | 45.4 | ||
| Conservative | Del Booth | 246 | 33.2 | ||
| Independent | Dean Smith | 94 | 12.7 | ||
| Liberal Democrats | Michael Mihalilovic | 65 | 8.8 | ||
| Majority | |||||
| Turnout | 749 | 31.2 | |||
| Labour hold | Swing | ||||
Rubery North
| Party | Candidate | Votes | % | ±% | |
|---|---|---|---|---|---|
| Labour | Peter McDonald | 526 | 67.0 | ||
| Conservative | Faye Kent | 259 | 33.0 | ||
| Majority | |||||
| Turnout | 807 | 33.2 | |||
| Labour hold | Swing | ||||
Rubery South
| Party | Candidate | Votes | % | ±% | |
|---|---|---|---|---|---|
| Conservative | Adrian Kriss | 352 | 39.7 | ||
| Labour | Christine McDonald | 323 | 36.5 | ||
| Independent | Stephen Capewell | 144 | 16.3 | ||
| Green | Kevin White | 67 | 7.6 | ||
| Majority | |||||
| Turnout | 892 | 36.1 | |||
| Conservative gain from Labour | Swing | ||||
Sanders Park
| Party | Candidate | Votes | % | ±% | |
|---|---|---|---|---|---|
| Conservative | Maria Androsova-Middleton | 467 | 55.6 | ||
| Labour | Gemma Weavis Long | 373 | 44.4 | ||
| Majority | |||||
| Turnout | 869 | 32.4 | |||
| Conservative gain from Labour | Swing | ||||
Sidemoor
| Party | Candidate | Votes | % | ±% | |
|---|---|---|---|---|---|
| Labour | Susan Douglas | 277 | 40.7 | ||
| Conservative | James Jarvis | 253 | 37.2 | ||
| Liberal Democrats | Joshua Robinson | 151 | 22.2 | ||
| Majority | |||||
| Turnout | 699 | 27.1 | |||
| Labour hold | Swing | ||||
Slideslow
| Party | Candidate | Votes | % | ±% | |
|---|---|---|---|---|---|
| Conservative | Caroline Spencer | 589 | 65.0 | ||
| Liberal Democrats | Samuel Evans | 159 | 17.5 | ||
| Labour | David Skidmore | 158 | 17.4 | ||
| Majority | |||||
| Turnout | 923 | 35.3 | |||
| Conservative hold | Swing | ||||
Tardebigge
| Party | Candidate | Votes | % | ±% | |
|---|---|---|---|---|---|
| Conservative | Peter Whittaker | 472 | 55.1 | ||
| Independent | Sarah Courbet | 179 | 20.9 | ||
| Labour | Sean Shannon | 129 | 15.1 | ||
| Liberal Democrats | Nicholas Hind | 77 | 9.0 | ||
| Majority | |||||
| Turnout | 865 | 36.8 | |||
| Conservative hold | Swing | ||||
Wythall East
| Party | Candidate | Votes | % | ±% | |
|---|---|---|---|---|---|
| Conservative | Sarah Hession | 419 | 51.2 | ||
| Residents | Helen Cleaver | 345 | 42.1 | ||
| Liberal Democrats | Hazel Jonas | 55 | 6.7 | ||
| Majority | |||||
| Turnout | 829 | 33.9 | |||
| Conservative gain from Residents | Swing | ||||
Wythall West
| Party | Candidate | Votes | % | ±% | |
|---|---|---|---|---|---|
| Conservative | Geoffrey Denaro | 371 | 49.5 | ||
| Residents | Stephen Peters | 257 | 34.3 | ||
| Liberal Democrats | Sandra Docker | 62 | 8.3 | ||
| Labour | Katharine Wilshaw | 59 | 7.9 | ||
| Majority | |||||
| Turnout | 762 | 33.1 | |||
| Conservative hold | Swing | ||||
References
- ↑ "District council election results". www.bromsgrove.gov.uk. 28 July 2021. Retrieved 5 August 2021.
| Worcestershire CC | |
|---|---|
| Bromsgrove | |
| Malvern Hills | |
| Redditch | |
| Worcester | |
| Wychavon | |
| Wyre Forest | |
| Hereford & Worcester CC |
|
| |
This article is issued from Wikipedia. The text is licensed under Creative Commons - Attribution - Sharealike. Additional terms may apply for the media files.