| |||||||||||||||||||||||||||||||||||||||||||||||||||||||||||||
All 31 seats to Bromsgrove District Council 16 seats needed for a majority | |||||||||||||||||||||||||||||||||||||||||||||||||||||||||||||
|---|---|---|---|---|---|---|---|---|---|---|---|---|---|---|---|---|---|---|---|---|---|---|---|---|---|---|---|---|---|---|---|---|---|---|---|---|---|---|---|---|---|---|---|---|---|---|---|---|---|---|---|---|---|---|---|---|---|---|---|---|---|
| |||||||||||||||||||||||||||||||||||||||||||||||||||||||||||||
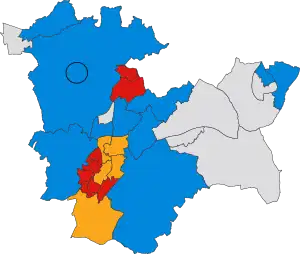 Winner of each seat at the 2023 Bromsgrove District Council election | |||||||||||||||||||||||||||||||||||||||||||||||||||||||||||||
| |||||||||||||||||||||||||||||||||||||||||||||||||||||||||||||
The 2023 Bromsgrove District Council election took place on 4 May 2023 to elect members of the Bromsgrove District Council in England.[1] It was held on the same day as other local elections.
Results summary
Election result
| 2023 Bromsgrove District Council election | ||||||||||
|---|---|---|---|---|---|---|---|---|---|---|
| Party | Candidates | Seats | Gains | Losses | Net gain/loss | Seats % | Votes % | Votes | +/− | |
| Conservative | 31 | 11 | 2 | 8 | 35.5 | 37.2 | 10,061 | -7.0 | ||
| Labour | 22 | 8 | 3 | 0 | 25.8 | 22.6 | 6131 | +0.7 | ||
| Independent | 13 | 7 | 3 | 1 | 22.6 | 18.3 | 4967 | +1.4 | ||
| Liberal Democrats | 21 | 5 | 3 | 1 | 16.1 | 19.2 | 5198 | +5.8 | ||
| Green | 9 | 0 | 0 | 0 | 0 | 2.7 | 741 | +0.9 | ||
| Reform UK | 1 | 0 | 0 | 0 | 0 | 0.2 | 63 | +0.2 | ||
| TUSC | 2 | 0 | 0 | 0 | 0 | 0.2 | 63 | +0.2 | ||
| Residents | 0 | 0 | 0 | 1 | 0.0 | 0.0 | 0 | –5.0 | ||
Ward results
Alvechurch South
| Party | Candidate | Votes | % | ±% | |
|---|---|---|---|---|---|
| Independent | Alan Bailes | 531 | 57.2 | N/A | |
| Conservative | Spencer Loades | 231 | 24.9 | ||
| Labour | Eric Godfrey | 131 | 14.1 | ||
| Liberal Democrats | Suzanne Nicholl | 34 | 3.7 | ||
| Majority | 300 | ||||
| Turnout | 929 | 40.4 | |||
| Independent gain from Independent | Swing | ||||
Alvechurch Village
| Party | Candidate | Votes | % | ±% | |
|---|---|---|---|---|---|
| Independent | Rachel Bailes | 487 | 55.5 | N/A | |
| Labour | Martin Mcleod | 166 | 18.9 | ||
| Conservative | Barry Thornton | 133 | 15.1 | ||
| Green | Martin Ball | 64 | 7.3 | N/A | |
| Liberal Democrats | Barry Thornton | 25 | 2.8 | N/A | |
| Majority | 321 | ||||
| Turnout | 878 | 38.8 | |||
| Independent gain from Independent | Swing | ||||
Aston Fields
| Party | Candidate | Votes | % | ±% | |
|---|---|---|---|---|---|
| Labour | Jane Elledge | 347 | 35.8 | ||
| Conservative | Kyle Daisley | 283 | 29.2 | ||
| Liberal Democrats | Martine Reynolds | 277 | 28.6 | N/A | |
| Green | Nick Trow | 56 | 5.8 | N/A | |
| Majority | 64 | ||||
| Turnout | 968 | 32.6 | |||
| Labour gain from Conservative | Swing | ||||
Avoncroft
| Party | Candidate | Votes | % | ±% | |
|---|---|---|---|---|---|
| Liberal Democrats | David Nicholl | 409 | 44.3 | ||
| Labour | John Ellis | 322 | 34.9 | ||
| Conservative | Philip Thomas | 189 | 20.5 | ||
| Majority | 87 | ||||
| Turnout | 923 | 32.6 | |||
| Liberal Democrats gain from Conservative | Swing | ||||
Barnt Green & Hopwood
| Party | Candidate | Votes | % | ±% | |
|---|---|---|---|---|---|
| Independent | Charlie Hotham | 682 | 68.5 | ||
| Conservative | Amritjot Nannar | 185 | 18.6 | ||
| Labour | Kiran Gulia | 123 | 12.4 | N/A | |
| Majority | 497 | ||||
| Turnout | 995 | 41.7 | |||
| Independent hold | Swing | ||||
Belbroughton & Romsley
| Party | Candidate | Votes | % | ±% | |
|---|---|---|---|---|---|
| Conservative | Karen May | 1,354 | 68.8 | ||
| Conservative | Simon Nock | 1,096 | 55.7 | ||
| Labour | Ros Cooke | 381 | 19.3 | ||
| Independent | Susan Jones | 316 | 16.0 | N/A | |
| Independent | Gary Prescott | 287 | 14.6 | N/A | |
| Independent | Stan Francis | 107 | 5.4 | N/A | |
| Majority | |||||
| Turnout | 1969 | 37.0 | |||
| Conservative hold | |||||
| Conservative hold | |||||
Bromsgrove Central
| Party | Candidate | Votes | % | ±% | |
|---|---|---|---|---|---|
| Liberal Democrats | Siobhan Robinson | 763 | 72.9 | ||
| Conservative | Luv Datta | 154 | 14.7 | ||
| Labour | David Peters | 118 | 11.3 | ||
| Majority | 609 | ||||
| Turnout | 1047 | 44.7 | |||
| Liberal Democrats hold | Swing | ||||
- The Conservative candidate announced his withdrawal on 17 April although his name remained on the ballot paper.[2]
Catshill North
| Party | Candidate | Votes | % | ±% | |
|---|---|---|---|---|---|
| Independent | Bernard McEldowney | 203 | 35.9 | N/A | |
| Labour | Andrew Glanville | 191 | 33.8 | ||
| Conservative | Mohammed Amin | 141 | 25.0 | ||
| Majority | 12 | ||||
| Turnout | 565 | 26.5 | |||
| Independent gain from Conservative | Swing | ||||
Catshill South
| Party | Candidate | Votes | % | ±% | |
|---|---|---|---|---|---|
| Conservative | Shirley Webb | 300 | 51.1 | ||
| Labour | Jenny Smith | 204 | 34.8 | ||
| Liberal Democrats | Barbara Murphy | 77 | 13.1 | ||
| Majority | 96 | ||||
| Turnout | 587 | 26.7 | |||
| Conservative hold | Swing | ||||
Charford
| Party | Candidate | Votes | % | ±% | |
|---|---|---|---|---|---|
| Labour | Sam Ammar | 284 | 57.7 | ||
| Conservative | Sam Johnson | 142 | 29.7 | ||
| Liberal Democrats | Gillian Bell | 62 | 12.6 | N/A | |
| Majority | 327 | ||||
| Turnout | 495 | 21.5 | |||
| Labour hold | Swing | ||||
Cofton
| Party | Candidate | Votes | % | ±% | |
|---|---|---|---|---|---|
| Conservative | Anita Dale | 318 | 37.5 | ||
| Labour | Christine McDonald | 277 | 28.5 | ||
| Green | Jill Harvey | 175 | 20.6 | ||
| Liberal Democrats | David Nicklin | 68 | 8.0 | ||
| Majority | 41 | ||||
| Turnout | 849 | 32.5 | |||
| Conservative hold | Swing | ||||
Drakes Cross
| Party | Candidate | Votes | % | ±% | |
|---|---|---|---|---|---|
| Independent | Sue Baxter | 372 | 56.5 | ||
| Conservative | Trevor Holman | 195 | 29.6 | ||
| Green | Matt Tovey | 48 | 7.3 | N/A | |
| Liberal Democrats | Alan Bell | 43 | 6.5 | N/A | |
| Majority | 177 | ||||
| Turnout | 661 | 27.1 | |||
| Independent gain from Residents | Swing | ||||
- The Residents Association candidate changed affiliation to Independent.
Hagley East
| Party | Candidate | Votes | % | ±% | |
|---|---|---|---|---|---|
| Conservative | Ruth Lambert | 387 | 45.7 | ||
| Independent | Lorraine Johnson | 353 | 41.7 | N/A | |
| Liberal Democrats | Mark Gibbons | 105 | 12.4 | N/A | |
| Majority | 34 | ||||
| Turnout | 846 | 34.5 | |||
| Conservative gain from Independent | Swing | ||||
Hagley West
| Party | Candidate | Votes | % | ±% | |
|---|---|---|---|---|---|
| Independent | Steven Colella | 827 | 78.0 | ||
| Conservative | Jayne Willetts | 155 | 14.6 | ||
| Green | Susan Robbins | 78 | 7.4 | N/A | |
| Majority | 672 | ||||
| Turnout | 1,062 | 35.8 | |||
| Independent hold | Swing | ||||
Hill Top
| Party | Candidate | Votes | % | ±% | |
|---|---|---|---|---|---|
| Labour | David Hopkins | 401 | 67.1 | ||
| Conservative | Martin Connellan | 100 | 16.7 | ||
| Liberal Democrats | Sara Woodhouse | 55 | 9.2 | N/A | |
| TUSC | Chloe Leslie | 42 | 7.0 | N/A | |
| Majority | 301 | ||||
| Turnout | 602 | 33.2 | |||
| Labour hold | Swing | ||||
Hollywood
| Party | Candidate | Votes | % | ±% | |
|---|---|---|---|---|---|
| Conservative | Derek Forsythe | 538 | 73.9 | ||
| Labour | Douglas Bridger | 186 | 9.4 | ||
| Majority | 352 | ||||
| Turnout | 728 | 31.0 | |||
| Conservative hold | Swing | ||||
Lickey Hills
| Party | Candidate | Votes | % | ±% | |
|---|---|---|---|---|---|
| Conservative | Bakul Kumar | 522 | 55.2 | ||
| Liberal Democrats | Janet King | 332 | 35.1 | ||
| Labour | John Cochrane | 87 | 9.2 | N/A | |
| Majority | 190 | ||||
| Turnout | 945 | 42.2 | |||
| Conservative gain from Liberal Democrats | Swing | ||||
Lowes Hill
| Party | Candidate | Votes | % | ±% | |
|---|---|---|---|---|---|
| Liberal Democrats | Joshua Robinson | 660 | 73.3 | ||
| Conservative | Rod Laight | 233 | 25.9 | ||
| Majority | 427 | ||||
| Turnout | 900 | 35.1 | |||
| Liberal Democrats gain from Conservative | Swing | ||||
Marlbrook
| Party | Candidate | Votes | % | ±% | |
|---|---|---|---|---|---|
| Conservative | Helen Jones | 439 | 50.6 | ||
| Labour | Alan Cooper | 220 | 25.3 | ||
| Green | Peter Harvey | 142 | 16.4 | ||
| Majority | 219 | ||||
| Turnout | 868 | 36.1 | |||
| Conservative hold | Swing | ||||
Norton
| Party | Candidate | Votes | % | ±% | |
|---|---|---|---|---|---|
| Liberal Democrats | Robert Hunter | 926 | 89.4 | ||
| Conservative | Kumar Muniandy | 110 | 10.6 | ||
| Majority | 816 | 78.8 | |||
| Turnout | 1,043 | 40.7 | |||
| Liberal Democrats hold | Swing | +12.7 | |||
Perryfields
| Party | Candidate | Votes | % | ±% | |
|---|---|---|---|---|---|
| Conservative | Kit Taylor | 240 | 47.3 | ||
| Labour | Antony Maslen | 175 | 34.5 | ||
| Liberal Democrats | Joanna McKenna | 90 | 17.8 | N/A | |
| Majority | 65 | ||||
| Turnout | 507 | 33.5 | |||
| Conservative hold | Swing | ||||
Rock Hill
| Party | Candidate | Votes | % | ±% | |
|---|---|---|---|---|---|
| Labour | Harrison Rone-Clarke | 453 | 61.2 | ||
| Conservative | Richard Williams | 170 | 23.0 | ||
| Liberal Democrats | Christopher Appleyard | 69 | 9.3 | ||
| Green | Lee Rowley | 41 | 5.5 | N/A | |
| Majority | 283 | ||||
| Turnout | 740 | 30.7 | |||
| Labour hold | Swing | ||||
Rubery North
| Party | Candidate | Votes | % | ±% | |
|---|---|---|---|---|---|
| Labour | Peter McDonald | 518 | 64.4 | ||
| Conservative | Andrew Beaumont | 278 | 34.6 | ||
| Majority | 240 | ||||
| Turnout | 804 | 33.2 | |||
| Labour hold | Swing | ||||
Rubery South
| Party | Candidate | Votes | % | ±% | |
|---|---|---|---|---|---|
| Labour | Esther Gray | 465 | 56.3 | ||
| Conservative | Nick Psirides | 289 | 35.0 | ||
| Green | Julian Gray | 67 | 7.6 | ||
| Majority | 176 | ||||
| Turnout | 826 | 32.6 | |||
| Labour gain from Conservative | Swing | ||||
Sanders Park
| Party | Candidate | Votes | % | ±% | |
|---|---|---|---|---|---|
| Labour | Mick Marshall | 347 | 37.5 | ||
| Liberal Democrats | Vanessa Verlinden | 243 | 26.3 | N/A | |
| Conservative | Mark Boulton | 198 | 21.4 | ||
| Independent | David Pardoe | 138 | 14.9 | N/A | |
| Majority | 104 | ||||
| Turnout | 926 | 33.5 | |||
| Labour gain from Conservative | Swing | ||||
Sidemoor
| Party | Candidate | Votes | % | ±% | |
|---|---|---|---|---|---|
| Labour | Graeme Stewart | 352 | 45.4 | ||
| Liberal Democrats | James Clarke | 213 | 27.5 | ||
| Conservative | Henry Morris | 183 | 23.6 | ||
| TUSC | Judi Byrne | 21 | 2.7 | N/A | |
| Majority | 139 | ||||
| Turnout | 775 | 28.7 | |||
| Labour hold | Swing | ||||
Slideslow
| Party | Candidate | Votes | % | ±% | |
|---|---|---|---|---|---|
| Liberal Democrats | Samuel Evans | 637 | 64.2 | ||
| Conservative | Michael Thompson | 342 | 34.5 | ||
| Majority | 295 | ||||
| Turnout | 992 | 36.7 | |||
| Liberal Democrats gain from Conservative | Swing | ||||
Tardebigge
| Party | Candidate | Votes | % | ±% | |
|---|---|---|---|---|---|
| Conservative | Peter Whittaker | 442 | 55.1 | ||
| Labour | Sean Shannon | 198 | 24.1 | ||
| Liberal Democrats | Valerie Clarke | 110 | 13.4 | ||
| Green | John Smout | 70 | 8.5 | N/A | |
| Majority | 244 | ||||
| Turnout | 823 | 34.1 | |||
| Conservative hold | Swing | ||||
Wythall East
| Party | Candidate | Votes | % | ±% | |
|---|---|---|---|---|---|
| Conservative | Justin Stanley | 378 | 54.2 | ||
| Independent | Keith Yates | 311 | 44.6 | N/A | |
| Majority | 67 | ||||
| Turnout | 697 | 28.3 | |||
| Conservative hold | Swing | ||||
Wythall West
| Party | Candidate | Votes | % | ±% | |
|---|---|---|---|---|---|
| Independent | Stephen Peters | 353 | 50.9 | N/A | |
| Conservative | Geoff Denaro | 336 | 48.5 | ||
| Majority | 17 | ||||
| Turnout | 693 | 30.0 | |||
| Independent gain from Conservative | Swing | ||||
References
- ↑ "District council election results" (PDF). www.bromsgrove.gov.uk. 5 May 2023. Retrieved 5 May 2023.
- ↑ "Bromsgrove Tory local election chaos as Luv Datta resigns after urgent investigation". Birmingham Mail. 17 April 2023.
| Worcestershire CC | |
|---|---|
| Bromsgrove | |
| Malvern Hills | |
| Redditch | |
| Worcester | |
| Wychavon | |
| Wyre Forest | |
| Hereford & Worcester CC |
|
| |
This article is issued from Wikipedia. The text is licensed under Creative Commons - Attribution - Sharealike. Additional terms may apply for the media files.