| ||||||||||||||||
All 36 seats to Chichester District Council 19 seats needed for a majority | ||||||||||||||||
|---|---|---|---|---|---|---|---|---|---|---|---|---|---|---|---|---|
| ||||||||||||||||
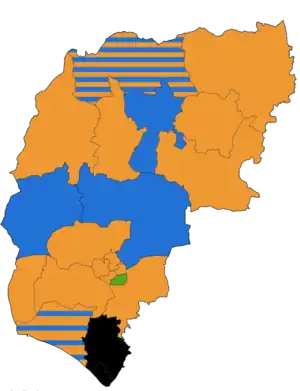 Map showing the results of the 2023 Chichester District Council elections by ward. | ||||||||||||||||
| ||||||||||||||||
Elections to Chichester District Council in West Sussex, United Kingdom were held on 4 May 2023. The election took place on the same day as other local elections.
The whole council was up for election, having previously been under no overall control and led by a Conservative minority administration.[1] The Liberal Democrats won 25 seats, the first time that the party (or any other than the Conservative Party) secured a majority on Chichester District Council.[2]
Summary
Election result
| 2023 Chichester District Council election[2] | ||||||||||
|---|---|---|---|---|---|---|---|---|---|---|
| Party | Candidates | Seats | Gains | Losses | Net gain/loss | Seats % | Votes % | Votes | +/− | |
| Liberal Democrats | 32 | 25 | 14 | 0 | ||||||
| Conservative | 36 | 5 | 0 | 13 | ||||||
| Local Alliance | 4 | 4 | 2 | 0 | ||||||
| Green | 12 | 2 | 0 | 0 | ||||||
| Labour | 17 | 0 | 0 | 2 | ||||||
| Reform UK | 2 | 0 | 0 | 0 | ||||||
| Independent | 2 | 0 | 0 | 1 | ||||||
| 25 | 5 | 4 | 2 |
| Liberal Democrats | Conservative | LA | Green |
Ward results
Chichester Central
| Party | Candidate | Votes | % | ±% | |
|---|---|---|---|---|---|
| Liberal Democrats | James Vivian | 404 | 46.0 | ||
| Conservative | Nicholas Roberts | 275 | 31.3 | ||
| Labour | James Field | 107 | 12.2 | ||
| Green | Mark Record | 92 | 10.5 | ||
| Majority | 129 | 14.7 | N/A | ||
| Turnout | 889 | 41.3 | |||
| Liberal Democrats gain from Conservative | Swing | ||||
Chichester East
| Party | Candidate | Votes | % | ±% | |
|---|---|---|---|---|---|
| Liberal Democrats | Bill Brisbane | 705 | 58.8 | ||
| Liberal Democrats | Rhys Chant | 613 | 51.1 | ||
| Labour | James Sandbach | 353 | 29.5 | ||
| Labour | Clare Walsh | 348 | 29.0 | ||
| Conservative | Peter Beveridge | 286 | 23.9 | ||
| Patria | Andrew Emerson | 92 | 7.7 | ||
| Majority | 352 | 29.4 | N/A | ||
| Majority | 265 | 22.1 | N/A | ||
| Turnout | 30.9 | ||||
| Liberal Democrats gain from Labour | Swing | ||||
| Liberal Democrats gain from Labour | Swing | ||||
Chichester North
| Party | Candidate | Votes | % | ±% | |
|---|---|---|---|---|---|
| Liberal Democrats | Jonathan Brown | 1,280 | 67.6 | ||
| Liberal Democrats | Maureen Corfield | 1,255 | 66.3 | ||
| Conservative | Alison Griffiths | 462 | 24.4 | ||
| Conservative | Giles Thompson | 448 | 23.7 | ||
| Labour | Olivia Connolly | 280 | 14.8 | ||
| Heritage | Teri Grieve | 68 | 3.6 | ||
| Majority | 818 | 43.2 | |||
| Majority | 807 | 42.6 | N/A | ||
| Turnout | 44.3 | ||||
| Liberal Democrats hold | Swing | ||||
| Liberal Democrats gain from Conservative | Swing | ||||
Chichester South
| Party | Candidate | Votes | % | ±% | |
|---|---|---|---|---|---|
| Green | Sarah Sharp | 1,287 | 83.6 | ||
| Green | Tim Young | 943 | 61.2 | ||
| Liberal Democrats | Joanne Kondabeka | 303 | 19.7 | ||
| Labour | Gareth Hitchman | 281 | 18.2 | ||
| Conservative | Simon Bailey | 266 | 17.3 | ||
| Majority | 984 | 63.9 | |||
| Majority | 662 | 43.0 | |||
| Turnout | 34.2 | ||||
| Green hold | Swing | ||||
| Green hold | Swing | ||||
Chichester West
| Party | Candidate | Votes | % | ±% | |
|---|---|---|---|---|---|
| Liberal Democrats | Clare Apel | 1,554 | 71.1 | ||
| Liberal Democrats | Sarah Quail | 1,403 | 64.2 | ||
| Conservative | Simon Lloyd-Williams | 549 | 25.1 | ||
| Conservative | David Millican | 540 | 24.7 | ||
| Labour | Adam Fyfe | 325 | 14.9 | ||
| Majority | 1005 | 46.0 | |||
| Majority | 863 | 39.5 | |||
| Turnout | 42.3 | ||||
| Liberal Democrats hold | Swing | ||||
| Liberal Democrats hold | Swing | ||||
Easebourne
| Party | Candidate | Votes | % | ±% | |
|---|---|---|---|---|---|
| Conservative | Francis Hobbs | 534 | 58.2 | ||
| Liberal Democrats | Carl Keeling | 243 | 26.5 | ||
| Green | Leo Homewood | 76 | 8.3 | ||
| Labour | Gordon Churchill | 65 | 7.1 | ||
| Majority | 291 | 31.7 | |||
| Turnout | 38.0 | ||||
| Conservative hold | Swing | ||||
Fernhurst
| Party | Candidate | Votes | % | ±% | |
|---|---|---|---|---|---|
| Liberal Democrats | Eleanora Newbery | 892 | 69.4 | ||
| Conservative | Brett Burkhart | 853 | 66.4 | ||
| Conservative | Peter Wilding | 825 | 64.2 | ||
| Majority | 67 | 5.2 | N/A | ||
| Majority | N/A | N/A | N/A | ||
| Turnout | 33.8 | ||||
| Liberal Democrats gain from Conservative | Swing | ||||
| Conservative hold | Swing | N/A | |||
Fittleworth
| Party | Candidate | Votes | % | ±% | |
|---|---|---|---|---|---|
| Liberal Democrats | John Cross | 534 | 47.5 | ||
| Conservative | Alan Sutton | 506 | 45.0 | ||
| Green | David Ross | 84 | 7.5 | ||
| Majority | 28 | 2.5 | N/A | ||
| Turnout | 44.4 | ||||
| Liberal Democrats gain from Conservative | Swing | ||||
Goodwood
| Party | Candidate | Votes | % | ±% | |
|---|---|---|---|---|---|
| Conservative | Henry Potter | 450 | 47.1 | ||
| Liberal Democrats | Jack Lovejoy | 283 | 29.6 | ||
| Green | Philip Maber | 222 | 23.2 | ||
| Majority | 167 | 17.5 | |||
| Turnout | 33.6 | ||||
| Conservative hold | Swing | ||||
Harbour Villages
| Party | Candidate | Votes | % | ±% | |
|---|---|---|---|---|---|
| Liberal Democrats | Adrian Moss | 2,342 | 68.1 | ||
| Liberal Democrats | Richard Bates | 2,257 | 65.6 | ||
| Liberal Democrats | Stephen Johnson | 2,066 | 60.1 | ||
| Conservative | Penny Plant | 855 | 24.9 | ||
| Conservative | Sandra James | 755 | 21.9 | ||
| Green | Georgina Armour Glasius | 705 | 20.5 | ||
| Conservative | Jane Kilby | 690 | 20.1 | ||
| Independent | Kevin Mann | 341 | 9.9 | ||
| Labour | Susan Walsh | 309 | 9.0 | ||
| Majority | 1487 | 43.2 | |||
| Majority | 1502 | 43.7 | |||
| Majority | 1361 | 39.6 | N/A | ||
| Turnout | 45.2 | ||||
| Liberal Democrats hold | Swing | ||||
| Liberal Democrats hold | Swing | ||||
| Liberal Democrats gain from Conservative | Swing | ||||
Harting
| Party | Candidate | Votes | % | ±% | |
|---|---|---|---|---|---|
| Liberal Democrats | Tim O'Kelly | 942 | 76.5 | ||
| Conservative | Bob Hall | 289 | 23.5 | ||
| Majority | 653 | 53.0 | |||
| Turnout | 43.8 | ||||
| Liberal Democrats hold | Swing | ||||
Lavant
| Party | Candidate | Votes | % | ±% | |
|---|---|---|---|---|---|
| Liberal Democrats | Joseph Brookes-Harmer | 475 | 45.8 | ||
| Conservative | David Palmer | 457 | 44.1 | ||
| Labour | Rhiannon Brome Thompson | 105 | 10.1 | ||
| Majority | 18 | 1.7 | N/A | ||
| Turnout | 40.6 | ||||
| Liberal Democrats gain from Conservative | Swing | ||||
Loxwood
| Party | Candidate | Votes | % | ±% | |
|---|---|---|---|---|---|
| Liberal Democrats | Gareth Evans | 1,805 | 78.4 | ||
| Liberal Democrats | Charles Todhunter | 1,556 | 67.6 | ||
| Conservative | Paul North | 711 | 30.9 | ||
| Conservative | Steve Waight | 530 | 23.0 | ||
| Majority | 1094 | 47.5 | |||
| Majority | 1026 | 44.6 | |||
| Turnout | 42.8 | ||||
| Liberal Democrats hold | Swing | ||||
| Liberal Democrats gain from Conservative | Swing | ||||
Midhurst
| Party | Candidate | Votes | % | ±% | |
|---|---|---|---|---|---|
| Liberal Democrats | Jessica Brown-Fuller | 1,326 | 64.9 | ||
| Liberal Democrats | Hannah Burton | 1,112 | 54.4 | ||
| Conservative | Tom Richardson | 817 | 40.0 | ||
| Conservative | Nicola Holben | 694 | 34.0 | ||
| Labour | Don Fraser | 138 | 6.8 | ||
| Majority | 509 | 24.9 | N/A | ||
| Majority | 418 | 20.5 | |||
| Turnout | 39.0 | ||||
| Liberal Democrats gain from Independent | Swing | ||||
| Liberal Democrats hold | Swing | ||||
North Mundham and Tangmere
| Party | Candidate | Votes | % | ±% | |
|---|---|---|---|---|---|
| Liberal Democrats | David Betts | 1,123 | 66.6 | ||
| Liberal Democrats | Charlie Hastain | 880 | 52.2 | ||
| Conservative | Simon Oakley | 649 | 38.5 | ||
| Conservative | Terry O'Brien | 468 | 27.7 | ||
| Labour | Mark Todd | 253 | 15.0 | ||
| Majority | 474 | 28.1 | N/A | ||
| Majority | 412 | 24.4 | N/A | ||
| Turnout | 32.5 | ||||
| Liberal Democrats gain from Conservative | Swing | ||||
| Liberal Democrats gain from Conservative | Swing | ||||
Petworth
| Party | Candidate | Votes | % | ±% | |
|---|---|---|---|---|---|
| Liberal Democrats | Harsha Desai | 616 | 53.5 | ||
| Conservative | Janet Duncton | 450 | 39.1 | ||
| Labour | Jonathan Rodell | 56 | 4.9 | ||
| Green | Stephanie Carn | 30 | 2.6 | ||
| Majority | 166 | 14.4 | N/A | ||
| Turnout | 42.2 | ||||
| Liberal Democrats gain from Conservative | Swing | ||||
Selsey South
| Party | Candidate | Votes | % | ±% | |
|---|---|---|---|---|---|
| Local Alliance | Tim Johnson | 741 | 51.2 | ||
| Local Alliance | Steve Boulcott | 729 | 50.4 | ||
| Conservative | Roger Barrow | 479 | 33.1 | ||
| Conservative | Colin Rickman | 452 | 31.2 | ||
| Green | Jack Olley | 168 | 11.6 | ||
| Labour | Heather Smith | 153 | 10.6 | ||
| Liberal Democrats | Jill Hilliard | 119 | 8.2 | ||
| Reform UK | Simon Edginton | 54 | 3.7 | ||
| Majority | 262 | 18.1 | |||
| Majority | 277 | 19.1 | N/A | ||
| Turnout | 33.2 | ||||
| Local Alliance hold | Swing | ||||
| Local Alliance gain from Conservative | Swing | ||||
Sidlesham with Selsey North
| Party | Candidate | Votes | % | ±% | |
|---|---|---|---|---|---|
| Local Alliance | Donna Johnson | 631 | 47.9 | ||
| Local Alliance | Val Weller | 502 | 38.1 | ||
| Conservative | Tom Bromfield | 457 | 34.7 | ||
| Conservative | Nick Rose | 448 | 34.0 | ||
| Green | Andrew Swain | 308 | 23.4 | ||
| Liberal Democrats | Beth Meek | 152 | 11.5 | ||
| Labour | Phil White | 135 | 10.3 | ||
| Majority | 174 | 13.2 | |||
| Majority | 54 | 4.1 | N/A | ||
| Turnout | 30.1 | ||||
| Local Alliance hold | Swing | ||||
| Local Alliance gain from Conservative | Swing | ||||
Southbourne
| Party | Candidate | Votes | % | ±% | |
|---|---|---|---|---|---|
| Liberal Democrats | Tracie Bangert | 1,226 | 68.9 | ||
| Liberal Democrats | Oona Hickson | 1,034 | 58.1 | ||
| Conservative | Jake Sawkins | 463 | 26.0 | ||
| Conservative | Bob Gould | 409 | 23.0 | ||
| Green | Derrick Johnson | 303 | 17.0 | ||
| Labour | Sorcha Galvin | 125 | 7.0 | ||
| Majority | 763 | 42.9 | |||
| Majority | 625 | 35.1 | |||
| Turnout | 34.0 | ||||
| Liberal Democrats hold | Swing | ||||
| Liberal Democrats hold | Swing | ||||
The Witterings
| Party | Candidate | Votes | % | ±% | |
|---|---|---|---|---|---|
| Liberal Democrats | Mark Chilton | 1,302 | 48.8 | ||
| Liberal Democrats | Iain Ballantyne | 1,234 | 46.3 | ||
| Conservative | Elizabeth Hamilton | 1,118 | 41.9 | ||
| Liberal Democrats | David Thompson | 1,112 | 41.7 | ||
| Conservative | Susan Taylor | 1,099 | 41.2 | ||
| Conservative | Joanna El-Batal | 996 | 37.4 | ||
| No Description | Graeme Barrett | 591 | 22.2 | ||
| Labour | Joe O'Sullivan | 374 | 14.0 | ||
| Reform UK | Pat Hunt | 172 | 6.5 | ||
| Majority | 203 | 7.6 | N/A | ||
| Majority | 238 | 8.9 | N/A | ||
| Majority | 6 | 0.2 | |||
| Turnout | 37.0 | ||||
| Liberal Democrats gain from Conservative | Swing | ||||
| Liberal Democrats gain from Conservative | Swing | ||||
| Conservative hold | Swing | ||||
Westbourne
| Party | Candidate | Votes | % | ±% | |
|---|---|---|---|---|---|
| Conservative | Roy Briscoe | 563 | 45.3 | ||
| Liberal Democrats | Helen Penfold | 543 | 43.7 | ||
| Green | Ann Stewart | 100 | 8.0 | ||
| Labour | Luca Clark-Gutierrez | 37 | 3.0 | ||
| Majority | 20 | 1.6 | |||
| Turnout | 46.8 | ||||
| Conservative hold | Swing | ||||
References
- ↑ Karen Dunn (29 September 2020). "Two Chichester councillors quit Conservatives". Greatest Hits Radio (Sussex).
- 1 2 "District and Parish Election Results 2023". Chichester District Council. 2023.
| West Sussex CC | |
|---|---|
| Adur | |
| Arun | |
| Chichester | |
| Crawley | |
| Horsham | |
| Mid Sussex | |
| Worthing | |
| |
This article is issued from Wikipedia. The text is licensed under Creative Commons - Attribution - Sharealike. Additional terms may apply for the media files.