Colcabamba
Qullqa Pampa | |
|---|---|
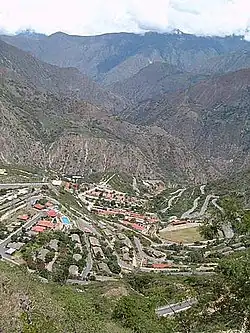 Campo Armiño, Colcabamba District | |
 Coat of arms | |
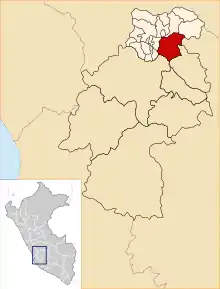 Location of Colcabamba in the Tayacaja province | |
| Coordinates: 12°24.5′S 74°40.6′W / 12.4083°S 74.6767°W | |
| Country | |
| Region | Huancavelica |
| Province | Tayacaja |
| Capital | Colcabamba |
| Government | |
| • Mayor | Augusto Maravi Romani |
| Area | |
| • Total | 598.12 km2 (230.94 sq mi) |
| Elevation | 2,979 m (9,774 ft) |
| Population | |
| • Total | 21,593 |
| • Density | 36/km2 (94/sq mi) |
| Time zone | UTC-5 (PET) |
| UBIGEO | 090705 |
Colcabamba (from Quechua: Qullqa Pampa, meaning "deposit plain") is one of sixteen districts of the Tayacaja Province in Peru.[1]
Geography
One of the highest peaks of the district is Atuq Punta at approximately 4,400 m (14,400 ft). Other mountains are listed below:[2]
- Arpayuq
- Ch'uñuna Mach'ay
- Kimsa Chumpi
- Minas Qucha
- Pakay Raqra
- Panti
- Parya Qaqa
- Pawkaray
- Qillwa Qucha
- Q'illu Qucha
- Tayanku
- Wanu Pata
- Waylla
- Wiska
Ethnic groups
The people in the district are mainly Indigenous citizens of Quechua descent. Quechua is the language which the majority of the population (76.32%) learnt to speak in childhood, 23.21% of the residents started speaking using the Spanish language (2007 Peru Census).[3]
Climate
| Climate data for Colcabamba (elevation 3,019 m (9,905 ft), 1991–2020 normals) | |||||||||||||
|---|---|---|---|---|---|---|---|---|---|---|---|---|---|
| Month | Jan | Feb | Mar | Apr | May | Jun | Jul | Aug | Sep | Oct | Nov | Dec | Year |
| Mean daily maximum °C (°F) | 18.1 (64.6) |
17.6 (63.7) |
17.7 (63.9) |
18.4 (65.1) |
19.0 (66.2) |
18.8 (65.8) |
18.6 (65.5) |
19.5 (67.1) |
19.4 (66.9) |
19.8 (67.6) |
20.3 (68.5) |
18.2 (64.8) |
18.8 (65.8) |
| Mean daily minimum °C (°F) | 9.2 (48.6) |
9.4 (48.9) |
9.3 (48.7) |
8.6 (47.5) |
7.8 (46.0) |
7.0 (44.6) |
6.3 (43.3) |
7.0 (44.6) |
8.2 (46.8) |
8.7 (47.7) |
9.3 (48.7) |
9.3 (48.7) |
8.3 (47.0) |
| Average precipitation mm (inches) | 174.7 (6.88) |
170.5 (6.71) |
152.5 (6.00) |
57.4 (2.26) |
22.7 (0.89) |
14.6 (0.57) |
13.4 (0.53) |
16.4 (0.65) |
34.6 (1.36) |
72.0 (2.83) |
65.5 (2.58) |
125.4 (4.94) |
919.7 (36.2) |
| Source: National Meteorology and Hydrology Service of Peru[4] | |||||||||||||
References
- ↑ (in Spanish) Instituto Nacional de Estadística e Informática. Banco de Información Distrital Archived April 23, 2008, at the Wayback Machine. Retrieved April 11, 2008.
- ↑ escale.minedu.gob.pe/ UGEL map Tayacaja Province (Apurímac Region) 2017
- ↑ inei.gob.pe Archived January 27, 2013, at the Wayback Machine INEI, Peru, Censos Nacionales 2007, Frequencias: Preguntas de Población: Idioma o lengua con el que aprendió hablar (in Spanish)
- ↑ "Normales Climaticás Estándares y Medias 1991-2020". National Meteorology and Hydrology Service of Peru. Archived from the original on 21 August 2023. Retrieved 6 November 2023.
| |
|---|---|
| Acobamba | |
| Angaraes | |
| Castrovirreyna | |
| Churcampa | |
| Huancavelica | |
| Huaytará | |
| Tayacaja | |
This article is issued from Wikipedia. The text is licensed under Creative Commons - Attribution - Sharealike. Additional terms may apply for the media files.