Le Mérévillois | |
|---|---|
_H%C3%B4tel_de_ville-1.jpg.webp) The town hall in Le Mérévillois | |
.svg.png.webp) Coat of arms | |
Location of Le Mérévillois | |
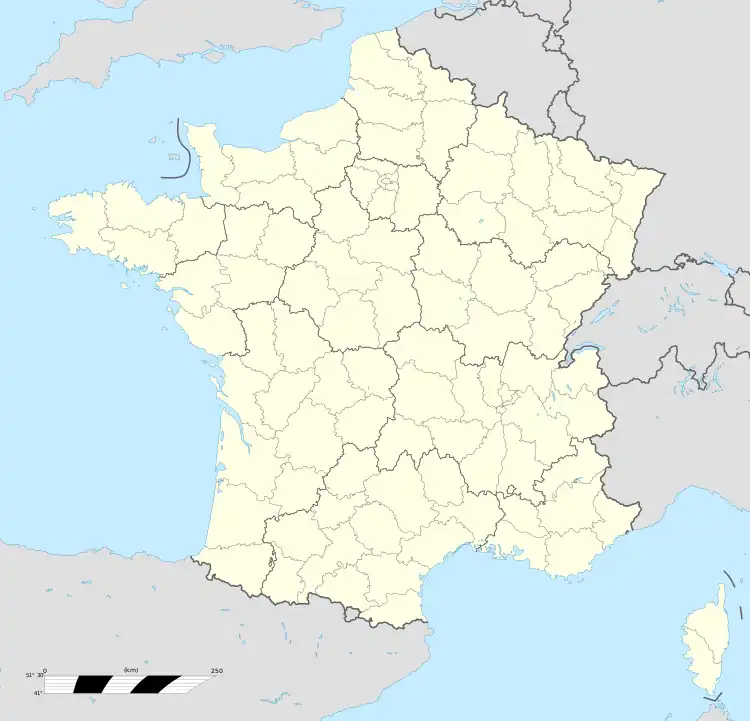 Le Mérévillois 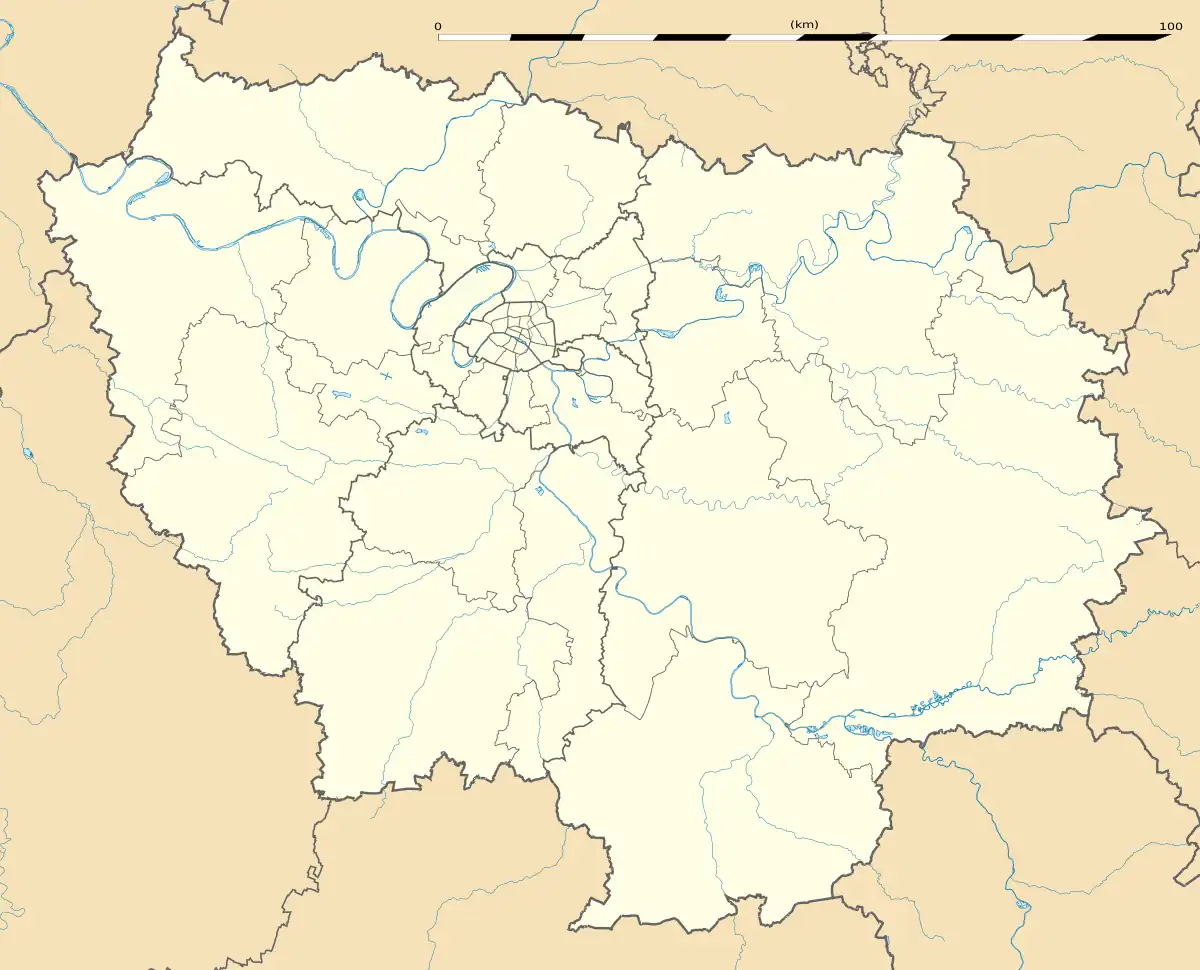 Le Mérévillois | |
| Coordinates: 48°19′6″N 2°5′13″E / 48.31833°N 2.08694°E | |
| Country | France |
| Region | Île-de-France |
| Department | Essonne |
| Arrondissement | Étampes |
| Canton | Étampes |
| Intercommunality | CA Étampois Sud Essonne |
| Government | |
| • Mayor (2020–2026) | Guy Desmurs[1] |
| Area 1 | 32.97 km2 (12.73 sq mi) |
| Population | 3,364 |
| • Density | 100/km2 (260/sq mi) |
| Time zone | UTC+01:00 (CET) |
| • Summer (DST) | UTC+02:00 (CEST) |
| INSEE/Postal code | 91390 /91660 |
| Elevation | 82–142 m (269–466 ft) |
| 1 French Land Register data, which excludes lakes, ponds, glaciers > 1 km2 (0.386 sq mi or 247 acres) and river estuaries. | |
Le Mérévillois (French pronunciation: [lə meʁevilwa]) is a commune in the department of Essonne.
It was established on 1 January 2019 from the amalgamation of the communes of Méréville and Estouches.[3]
Geography
Climate
Le Mérévillois has a oceanic climate (Köppen climate classification Cfb). The average annual temperature in Le Mérévillois is 11.1 °C (52.0 °F). The average annual rainfall is 639.1 mm (25.16 in) with May as the wettest month. The temperatures are highest on average in July, at around 19.3 °C (66.7 °F), and lowest in January, at around 3.8 °C (38.8 °F). The highest temperature ever recorded in Le Mérévillois was 42.0 °C (107.6 °F) on 25 July 2019; the coldest temperature ever recorded was −18.0 °C (−0.4 °F) on 17 January 1985.
| Climate data for Le Mérévillois (1981−2010 normals, extremes 1979−2020) | |||||||||||||
|---|---|---|---|---|---|---|---|---|---|---|---|---|---|
| Month | Jan | Feb | Mar | Apr | May | Jun | Jul | Aug | Sep | Oct | Nov | Dec | Year |
| Record high °C (°F) | 16.0 (60.8) |
21.2 (70.2) |
24.0 (75.2) |
30.0 (86.0) |
32.0 (89.6) |
37.0 (98.6) |
42.0 (107.6) |
41.2 (106.2) |
34.0 (93.2) |
30.2 (86.4) |
22.0 (71.6) |
16.5 (61.7) |
42.0 (107.6) |
| Mean daily maximum °C (°F) | 6.6 (43.9) |
7.8 (46.0) |
12.0 (53.6) |
15.3 (59.5) |
19.3 (66.7) |
22.7 (72.9) |
25.8 (78.4) |
25.6 (78.1) |
21.5 (70.7) |
16.3 (61.3) |
10.4 (50.7) |
6.9 (44.4) |
15.9 (60.6) |
| Daily mean °C (°F) | 3.8 (38.8) |
4.2 (39.6) |
7.4 (45.3) |
9.9 (49.8) |
13.8 (56.8) |
16.8 (62.2) |
19.3 (66.7) |
19.1 (66.4) |
15.7 (60.3) |
11.9 (53.4) |
7.1 (44.8) |
4.3 (39.7) |
11.1 (52.0) |
| Mean daily minimum °C (°F) | 1.0 (33.8) |
0.6 (33.1) |
2.8 (37.0) |
4.6 (40.3) |
8.3 (46.9) |
10.9 (51.6) |
12.8 (55.0) |
12.6 (54.7) |
9.9 (49.8) |
7.4 (45.3) |
3.8 (38.8) |
1.6 (34.9) |
6.4 (43.5) |
| Record low °C (°F) | −18.0 (−0.4) |
−13.0 (8.6) |
−13.2 (8.2) |
−5.4 (22.3) |
−2.0 (28.4) |
−0.5 (31.1) |
3.0 (37.4) |
3.5 (38.3) |
1.0 (33.8) |
−4.0 (24.8) |
−13.0 (8.6) |
−13.5 (7.7) |
−18.0 (−0.4) |
| Average precipitation mm (inches) | 51.5 (2.03) |
43.5 (1.71) |
46.8 (1.84) |
50.5 (1.99) |
65.3 (2.57) |
49.2 (1.94) |
56.9 (2.24) |
47.9 (1.89) |
49.1 (1.93) |
63.0 (2.48) |
54.7 (2.15) |
60.7 (2.39) |
639.1 (25.16) |
| Average precipitation days (≥ 1.0 mm) | 11.2 | 9.7 | 10.2 | 9.8 | 10.6 | 8.1 | 8.1 | 6.6 | 8.2 | 10.4 | 10.2 | 11.3 | 114.4 |
| Source: Météo-France[4] | |||||||||||||
Population
| Year | Pop. | ±% p.a. |
|---|---|---|
| 1968 | 2,310 | — |
| 1975 | 2,480 | +1.02% |
| 1982 | 2,853 | +2.02% |
| 1990 | 3,033 | +0.77% |
| 1999 | 3,248 | +0.76% |
| 2007 | 3,381 | +0.50% |
| 2012 | 3,380 | −0.01% |
| 2017 | 3,347 | −0.20% |
| Source: INSEE[5] | ||
References
- ↑ "Répertoire national des élus: les maires" (in French). data.gouv.fr, Plateforme ouverte des données publiques françaises. 13 September 2022.
- ↑ "Populations légales 2021". The National Institute of Statistics and Economic Studies. 28 December 2023.
- ↑ "CP Création de la commune nouvelle "Le Mérévillois"" (PDF). 2 October 2018.
- ↑ "Fiche Climatologique Statistiques 1981-2010 et records" (PDF) (in French). Météo-France. Retrieved August 31, 2022.
- ↑ Population en historique depuis 1968, INSEE
This article is issued from Wikipedia. The text is licensed under Creative Commons - Attribution - Sharealike. Additional terms may apply for the media files.