Plateau d'Hauteville | |
|---|---|
Commune | |
 Town hall | |
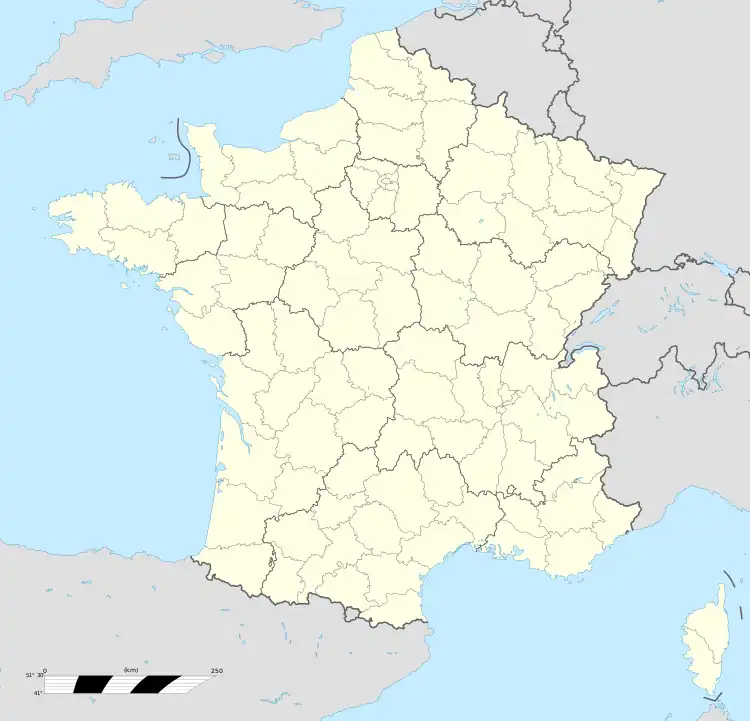
Location of Plateau d'Hauteville | |
 Plateau d'Hauteville 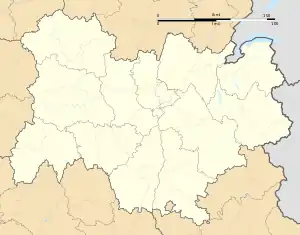 Plateau d'Hauteville | |
| Coordinates: 45°58′38″N 5°36′06″E / 45.9772°N 5.6018°E | |
| Country | France |
| Region | Auvergne-Rhône-Alpes |
| Department | Ain |
| Arrondissement | Belley |
| Canton | Plateau d'Hauteville |
| Intercommunality | Haut-Bugey Agglomération |
| Government | |
| • Mayor (2020–2026) | Philippe Emin[1] |
| Area 1 | 106.11 km2 (40.97 sq mi) |
| Population | 4,807 |
| • Density | 45/km2 (120/sq mi) |
| Time zone | UTC+01:00 (CET) |
| • Summer (DST) | UTC+02:00 (CEST) |
| INSEE/Postal code | 01185 /01110 |
| Elevation | 455–1,241 m (1,493–4,072 ft) |
| 1 French Land Register data, which excludes lakes, ponds, glaciers > 1 km2 (0.386 sq mi or 247 acres) and river estuaries. | |
Plateau d'Hauteville (French pronunciation: [plato dotvil]) is a commune in the Ain department in eastern France. The municipality was established on 1 January 2019 by merger of the former communes of Cormaranche-en-Bugey, Hauteville-Lompnes (the seat), Hostiaz and Thézillieu.[3]
Geography
The river Albarine flows through the commune.
Climate
Plateau d'Hauteville has a oceanic climate (Köppen climate classification Cfb). The average annual temperature in Plateau d'Hauteville is 8.4 °C (47.1 °F). The average annual rainfall is 1,564.4 mm (61.59 in) with November as the wettest month. The temperatures are highest on average in July, at around 17.1 °C (62.8 °F), and lowest in January, at around 0.3 °C (32.5 °F). The highest temperature ever recorded in Plateau d'Hauteville was 35.7 °C (96.3 °F) on 12 August 2003; the coldest temperature ever recorded was −22.4 °C (−8.3 °F) on 1 March 2005.
| Climate data for Hauteville-Lompnes, Plateau d'Hauteville (1981–2010 averages, extremes 1989−2017) | |||||||||||||
|---|---|---|---|---|---|---|---|---|---|---|---|---|---|
| Month | Jan | Feb | Mar | Apr | May | Jun | Jul | Aug | Sep | Oct | Nov | Dec | Year |
| Record high °C (°F) | 16.4 (61.5) |
19.1 (66.4) |
22.2 (72.0) |
25.5 (77.9) |
30.0 (86.0) |
34.0 (93.2) |
34.4 (93.9) |
35.7 (96.3) |
28.7 (83.7) |
25.1 (77.2) |
21.1 (70.0) |
17.2 (63.0) |
35.7 (96.3) |
| Mean daily maximum °C (°F) | 5.2 (41.4) |
6.5 (43.7) |
10.1 (50.2) |
12.8 (55.0) |
18.0 (64.4) |
21.3 (70.3) |
23.8 (74.8) |
23.7 (74.7) |
18.7 (65.7) |
14.6 (58.3) |
8.5 (47.3) |
5.1 (41.2) |
14.1 (57.4) |
| Daily mean °C (°F) | 0.3 (32.5) |
1.3 (34.3) |
4.4 (39.9) |
7.1 (44.8) |
11.8 (53.2) |
14.8 (58.6) |
17.1 (62.8) |
16.9 (62.4) |
12.7 (54.9) |
9.4 (48.9) |
4.0 (39.2) |
0.7 (33.3) |
8.4 (47.1) |
| Mean daily minimum °C (°F) | −4.5 (23.9) |
−4.0 (24.8) |
−1.3 (29.7) |
1.4 (34.5) |
5.7 (42.3) |
8.4 (47.1) |
10.4 (50.7) |
10.1 (50.2) |
6.7 (44.1) |
4.1 (39.4) |
−0.5 (31.1) |
−3.6 (25.5) |
2.8 (37.0) |
| Record low °C (°F) | −21.0 (−5.8) |
−22.3 (−8.1) |
−22.4 (−8.3) |
−9.2 (15.4) |
−3.0 (26.6) |
−1.2 (29.8) |
1.4 (34.5) |
0.8 (33.4) |
−3.2 (26.2) |
−9.6 (14.7) |
−15.3 (4.5) |
−20.7 (−5.3) |
−22.4 (−8.3) |
| Average precipitation mm (inches) | 122.9 (4.84) |
128.4 (5.06) |
117.3 (4.62) |
128.1 (5.04) |
124.5 (4.90) |
100.4 (3.95) |
109.8 (4.32) |
117.5 (4.63) |
139.5 (5.49) |
156.8 (6.17) |
167.5 (6.59) |
151.7 (5.97) |
1,564.4 (61.59) |
| Average precipitation days (≥ 1.0 mm) | 11.1 | 11.0 | 10.7 | 11.4 | 12.1 | 10.1 | 9.6 | 9.8 | 9.7 | 12.0 | 12.4 | 12.2 | 132.0 |
| Source: Meteociel[4] | |||||||||||||
Population
| Year | Pop. | ±% p.a. |
|---|---|---|
| 1968 | 4,766 | — |
| 1975 | 4,868 | +0.30% |
| 1982 | 4,516 | −1.07% |
| 1990 | 4,952 | +1.16% |
| 1999 | 4,749 | −0.46% |
| 2007 | 5,350 | +1.50% |
| 2012 | 5,135 | −0.82% |
| 2017 | 4,853 | −1.12% |
| Source: INSEE[5] | ||
See also
References
- ↑ "Répertoire national des élus: les maires" (in French). data.gouv.fr, Plateforme ouverte des données publiques françaises. 13 September 2022.
- ↑ "Populations légales 2021". The National Institute of Statistics and Economic Studies. 28 December 2023.
- ↑ Arrêté préfectoral 12 December 2018 (in French)
- ↑ "Normales et records pour Hauteville (01)". Meteociel. Retrieved 12 June 2022.
- ↑ Population en historique depuis 1968, INSEE